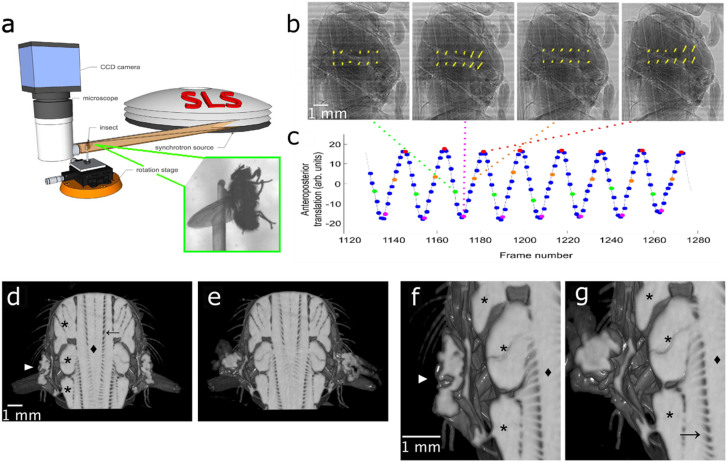
Figure 1. Experimental arrangement and retrospective gating.
(a) The X-ray micro-tomography acquisition system (b) Normalized projections at four stages of one wingbeat cycle, with local image motion vectors (yellow arrows). The translation vectors were found by spatial cross-correlation of consecutive projections tracking the movements of twelve evenly spaced regions each containing 24 × 24 pixels. Orientation: head-neck joint at the top, posterior end of the thorax at the lower end of the images. Sequence of wingbeat phases from left to right: dorsal stroke reversal, downstroke, ventral stroke reversal, upstroke. (c) The gating signal (blue) derived from spatial cross-correlation of successive projections (after smoothing). The peaks of the signal (red points) identified the beginning of each new wing beat cycle, which was divided into uniformly spaced wingbeat phases. The green, pink, and orange points correspond to the phases of the wing beat shown in (b). (d–g) Rendering of the fly (d,e) thorax and (f,g) wing hinge ( ) during (d,f) dorsal and (e,g) ventral stroke reversal (orientation: anterior towards the top, posterior towards the bottom). A frontal clipping plane has been introduced to reveal the large dorsal longitudinal and dorsoventral flight muscles, DLMs (
 ) and DVMs (*), respectively. The ladder-like structure spanning the flight muscles is the tracheal network (→). At the level of the wing hinge, clear deformations of the exoskeleton are visible.

