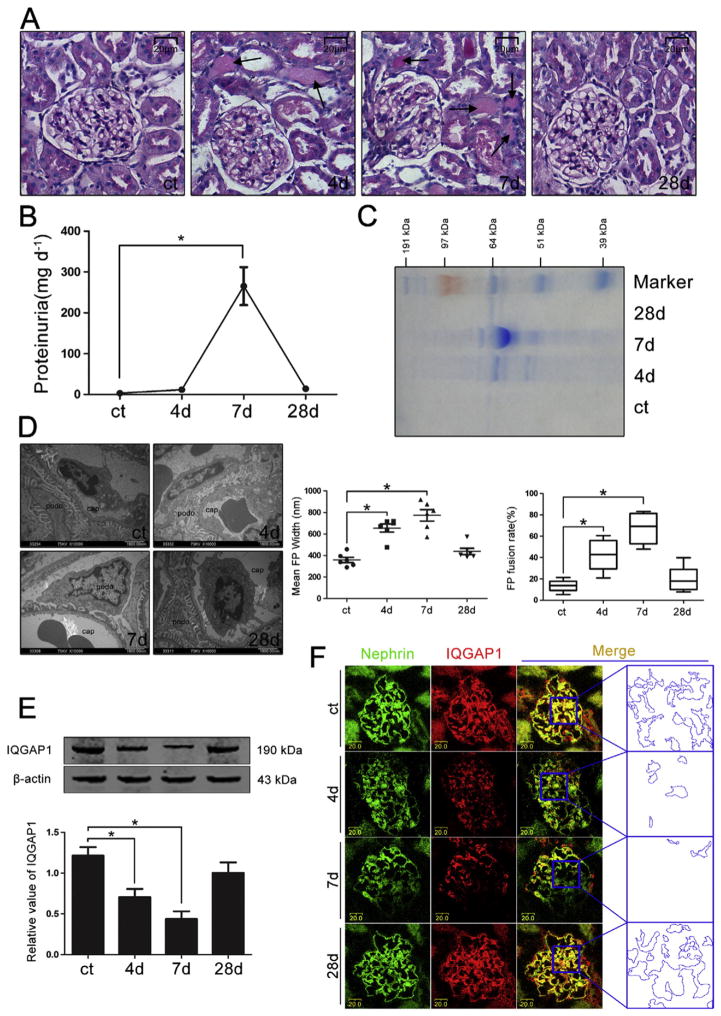
Fig. 1.
The expression and distribution of IQGAP1 in glomeruli during PAN nephrosis. (A) Representative microscopy images of renal pathological changes in various groups (PAS staining, original magnification ×200). Scale bar = 20 μm. The black arrows indicate protein cast in the renal tubular lumen. (B) Quantitative analysis of urinary protein excretion in various groups (n = 6). (C) Coomassie brilliant blue staining of urinary protein in various groups. (D) Representative transmission electron microscopy images of glomerular capillary walls (original magnification ×10,000) and quantitative analysis of the FP width and FP fusion rate (n = 6). Scale bar = 1900 nm. Podo, podocyte. Cap, capillary lumen. (E) Western blotting analysis of glomerular IQGAP1 in various groups (n = 6). (F) Double immunolabeling of nephrin and IQGAP1 in glomeruli (original magnification ×400). The colocalization area of nephrin and IQGAP1 indicated by the blue dotted line is an enlarged view of the boxed region. Scale bar = 20 μm. *p < 0.05 relative to control.

