Figure 2.

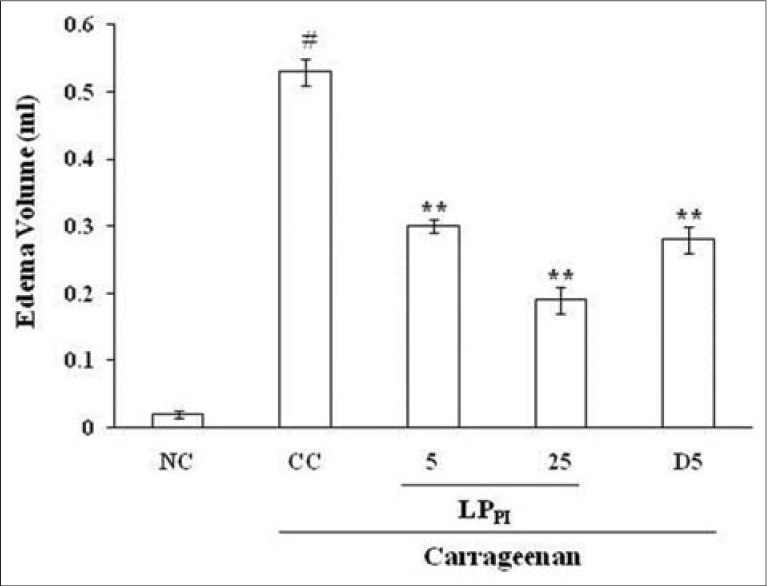
Effect of LPPI on edema volume. NC: Normal control; CC: Carrageenan control. Values given are mean ± standard error of the mean (#P≤ 0.001 vs. NC; ** P ≤ 0.001 vs. CC)

Effect of LPPI on edema volume. NC: Normal control; CC: Carrageenan control. Values given are mean ± standard error of the mean (#P≤ 0.001 vs. NC; ** P ≤ 0.001 vs. CC)