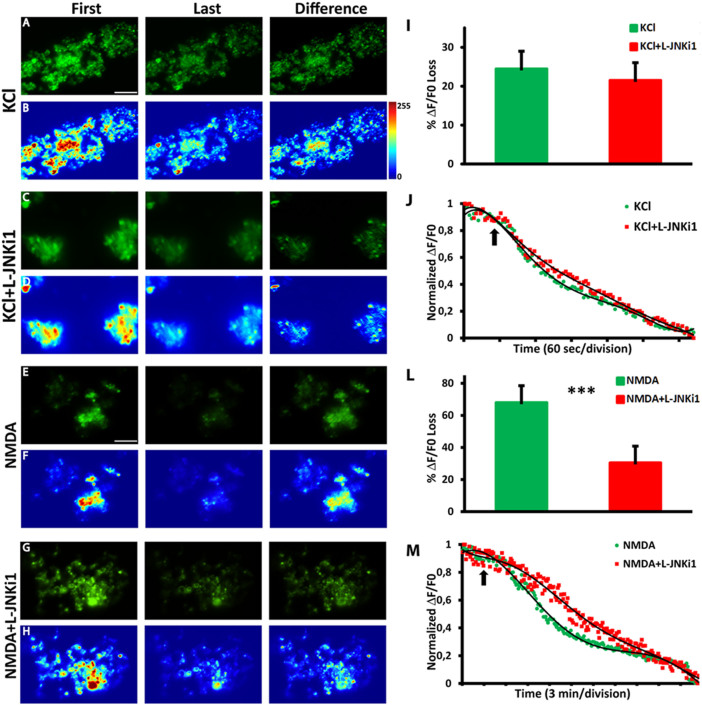
Figure 3. L-JNKi1 pretreatment does not affect KCl responses but reduces NMDA stimulated exocytosis.
Representative images of Synaptogreen (FM 1-43) stained cortical synaptosomes stimulated after 1 min with KCl alone (A) or pretreated with L-JNKi1 (C) and recorded for 6 min; or stimulated after 4 min with NMDA alone (E) or pretreated with L-JNKi1 (G) and recorded for 30 min. First, is the first image of the time-lapse sequence. Last, is the last image of the time-lapse sequence. Difference, is the image obtained by subtracting the last image to the first of the time-lapse sequence. (B,D,F,H) are the corresponding fluorescence intensity color map (Jet Palette) images. Brighter spots correspond to functional presynaptic terminals. (I) Average percentage of fluorescence loss for KCl (green) and KCl + L-JNKi1 (red). (J) Representative traces of destaining time courses for KCl and KCl + L-JNKi1. Arrow indicates the KCl stimulus. (L) Average percentage of fluorescence loss for NMDA + glycine and NMDA + glycine + L-JNKi1. (M) Representative traces of destaining time courses for NMDA + glycine (green) and NMDA + glycine + L-JNKi1 (red). Arrow indicates the NMDA stimulus. Data are derived from four independent experiments. In each experiment three coverslips for each experimental group were analyzed. Scale bar A and J = 10 μm.

