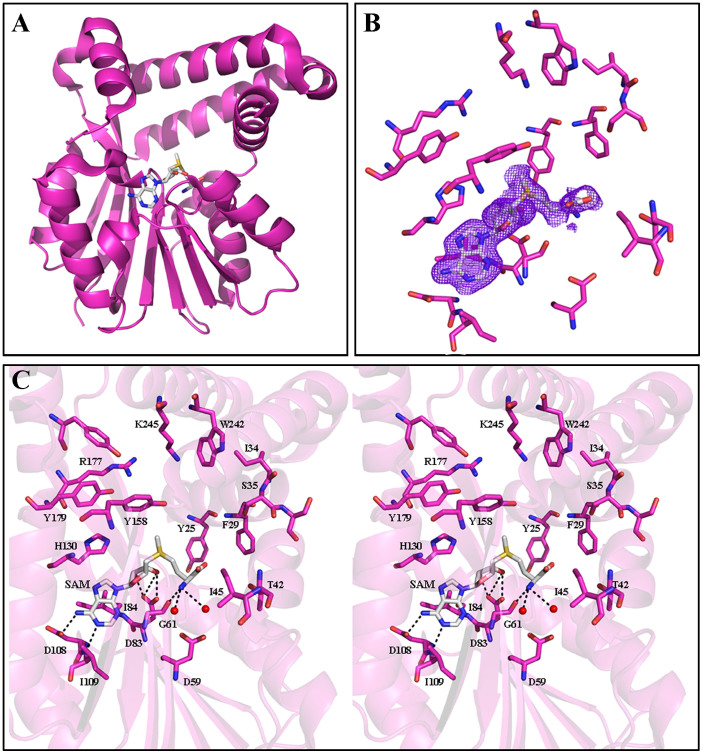
Figure 8. An overview of the crystal structure of PkPMT in complex with SAM (PDB code: 4IV8).
(A) Folds of PkPMT shown as cartoon (pink) with SAM (gray) in stick representation. (B) Omit σA-weighted mFo-Fc electron density map for SAM bound to PkPMT active site (contour level at 1.0 σ). (C) Stereo view of active site residues of PkPMT (pink) interacting with SAM (gray). Water is represented as spheres (red). Hydrogen bonds (<3.5 Å) are indicated as dashed lines.

