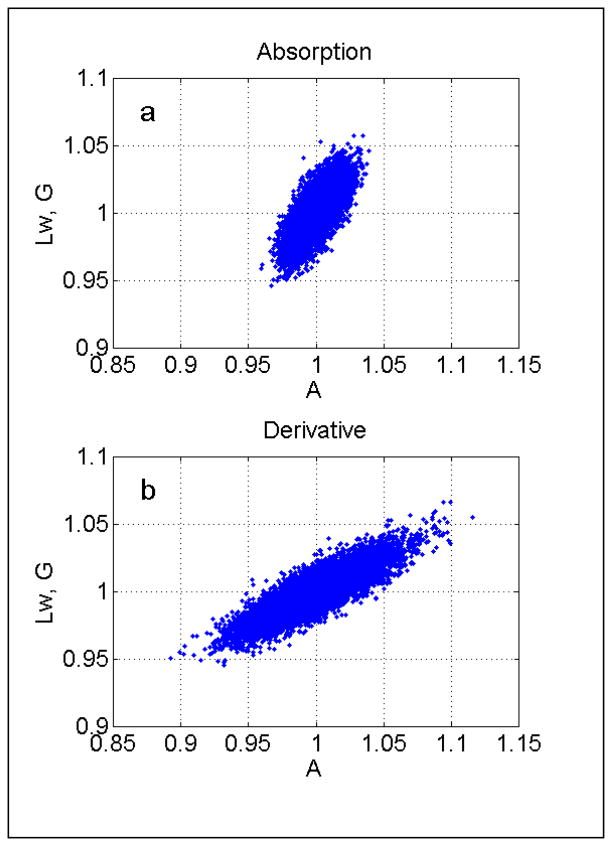
Fig.1.
Scatter plots for A and Lw obtained for absorption (a) and first-derivative Lorentzian spectra (b). Each subplot has 5,000 points corresponding to the fitting results of 5,000 numerical experiments. In each experiment random noise was added to the absorption and derivative spectra with A0 = 1, Lw0 = 1G. The standard deviation of noise, σ, was selected to produce spectra with SNR=5.

