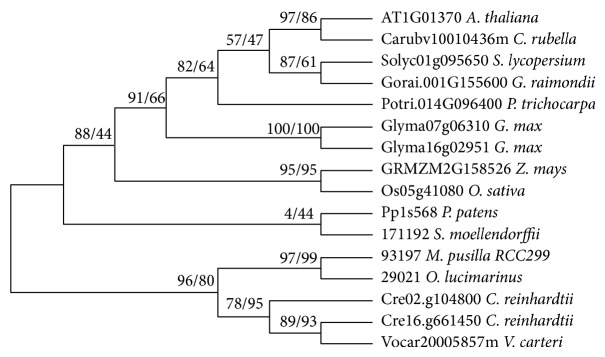
Figure 3.

Phylogeny of plant centromeric H3 variants CenH3. For each node, statistical support values are marked (numbers from left to right: neighbor joining inferred under JTT + G models and maximum-likelihood bootstraps inferred using LG + G model).
