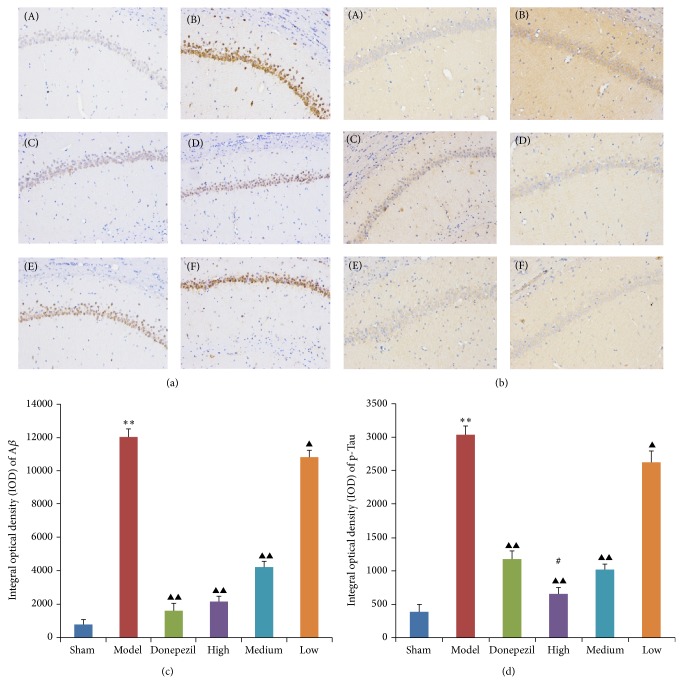
Figure 5.
The representative immunohistochemistry micrographs of Aβ deposits (a) and p-Tau aggregations (b) in hippocampus CA1 tissues. (A) Sham operation group, (B) AD model group, (C) donepezil group, (D) high dose TDJW group, (E) medium dose TDJW group, and (F) low dose TDJW group. The IOD values of Aβ deposits (c) and p-Tau aggregations (d) were calculated by analyzing the corresponding brownish yellow area in each microscopic image using Image-Pro Plus6.0 software. All the data are presented as mean ± SEM. ** P < 0.01, model versus sham; ▲ P < 0.05, ▲▲ P < 0.01, donepezil or TDJW (high, medium, low) versus model; # P < 0.05, TDJW (high, medium, low) versus donepezil.

