
Figure 2.
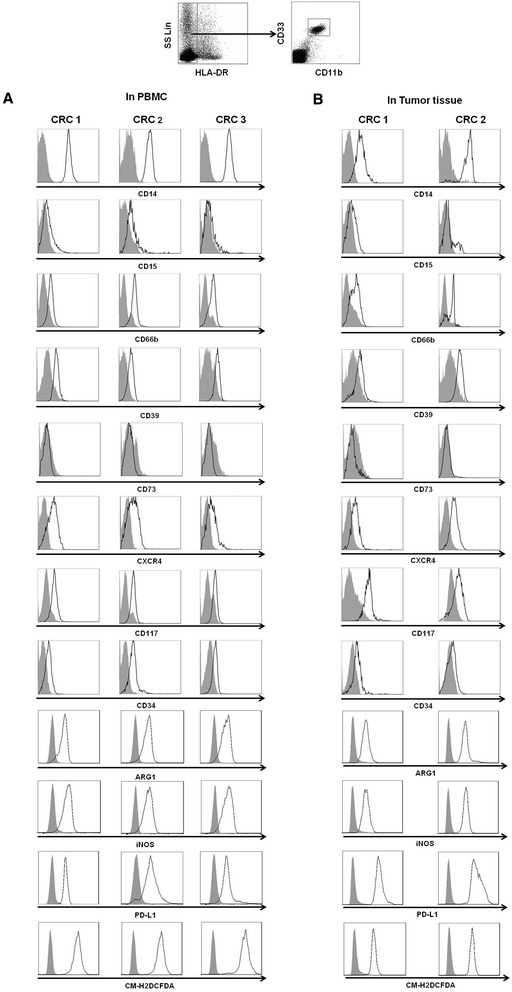
Phenotypes of HLA-DR − CD33 + CD11b + MDSCs in CRC patients. HLA-DR−CD33+CD11b+ cells were gated as MDSCs from either PBMCs (A) or tumor tissues (B) from CRC patients. The phenotypes of the MDSCs were analyzed with flow cytometry using multiple anti-human mAbs against CD14, CD15, CD66b, CD39, CD73, CXCR4, CD117, CD34, ARG1, INOS, PD-L1 and DCFDA as indicated, and the grey curve represents autofluorescence as a negative control. Representative histograms are shown.