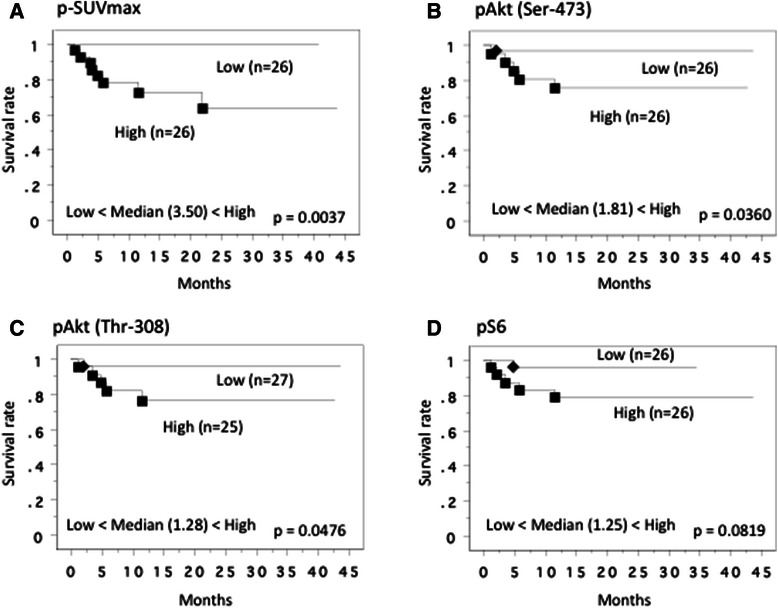
Figure 6.

Recurrence free-survival curve in 52 M0 cases at nephrectomy. This survival curve is based on the median values of SUVmax (A) and protein expression of pAkt(Ser-473) (B), pAkt(Thr-308) (C) and pS6 proteins (D) in the primary tumor. The cases were divided into two groups at this levels - high and low expression. P value was analyzed by log-rank test.
