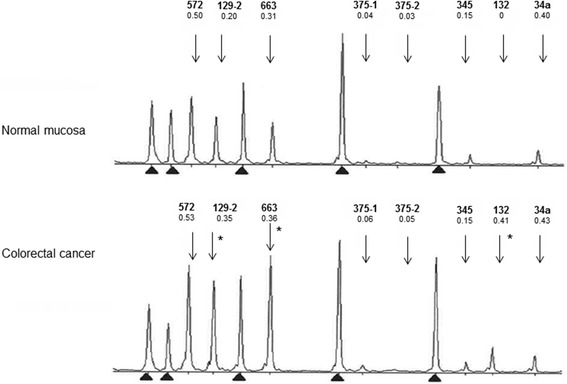
Figure 2.

Electropherograms for paired normal and tumor DNA to illustrate a typical output from the custom-made MS-MLPA test. A single case from the Finnish MSI-CRC group is shown. Dm values obtained for each miRNA locus are given below the name of the miRNA. Arrows denote the peak positions of the miRNAs which reflect the sizes of the amplified fragments (Additional file 5: Table S3). Based on cutoff values for hypermethylation derived from this series (Additional file 8: Table S5), the tumor shows hypermethylation at miRNA loci 129-2, 663, and 132 (asterisks). Reference peaks are indicated by arrowheads.
