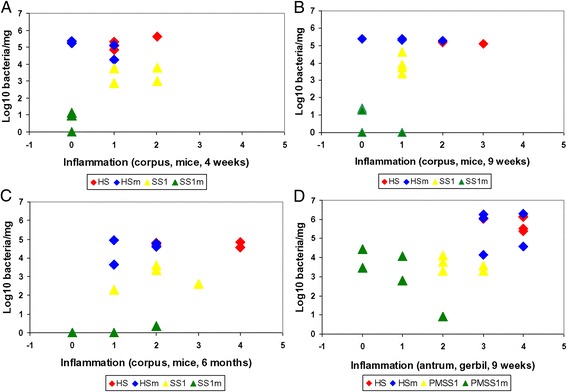
Figure 1.

Correlation between bacterial colonization capacity and inflammation score in the stomach of mice and Mongolian gerbils. The colonization capacity is shown as log10 values of H. suis or H. pylori per mg tissue, determined with qRT-PCR in the corpus of mice (A-C) and antrum of Mongolian gerbils (D). 0, no infiltration with mononuclear and/or polymorphonuclear cells; 1, very mild diffuse infiltration with mononuclear and/or polymorphonuclear cells or the presence of one small (20–50 cells) aggregate of inflammatory cells; 2, mild diffuse infiltration with mononuclear and/or polymorphonuclear cells or the presence of one small (50–200 cells) aggregate of inflammatory cells; 3, moderate diffuse infiltration with mononuclear and/or polymorphonuclear cells and/or the presence of 2–4 inflammatory aggregates; 4, marked diffuse infiltration with mononuclear and/or polymorphonuclear cells and/or the presence of at least five inflammatory aggregates. HS vs. HSm: Colonization: p > 0.05; Inflammation: p < 0.05. SS1 vs. SS1m: Colonization: p < 0.05; Inflammation: p < 0.05. PMSS1 vs. PMSS1m: Colonization: p > 0.05; Inflammation: p < 0.05. HS: animals infected with WT H. suis srain HS5cLP; HSm: animals infected with H. suis strain HS5cLPΔggt; SS1: animals infected with WT H. pylori SS1; SS1m: animals infected with H. pylori SS1Δggt; PMSS1: animals infected with WT H. pylori PMSS1; PMSS1m: animals infected with H. pylori PMSS1Δggt.
