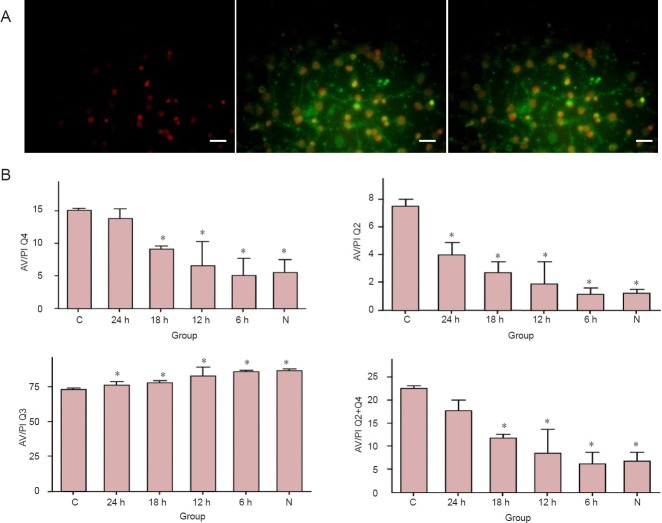
Figure 2.
Mild hypothermia reduced apoptosis in neurons subjected to oxygen-glucose deprivation/reperfusion.
(A) Under the immunofluorescence microscope, PI-positive cells appear red (the left image); FITC-positive cells exhibit green fluorescence (the middle one); the right image is the merge of the left one and the middle one. Scale bars: 50 μm. (B) Quantification of apoptosis cells determined by flow cytometric analysis. Quadrant 3 (Q3) represented the unchanged cells, quadrant 2 (Q2) represented death or late apoptosis of the cells, and quadrant 4 (Q4) represented early apoptosis of the cells. The sum of Q2 + Q4 indicates the total apoptosis in the group. *P < 0.05, vs. C group. Each experiment was repeated three times. One-way analysis of variance followed by the least significant difference test was used for difference comparison between each group. 24, 18, 12, 6 h: 24, 18, 12, 6 hours of hypothermia treatment; N: normal; C: control.

