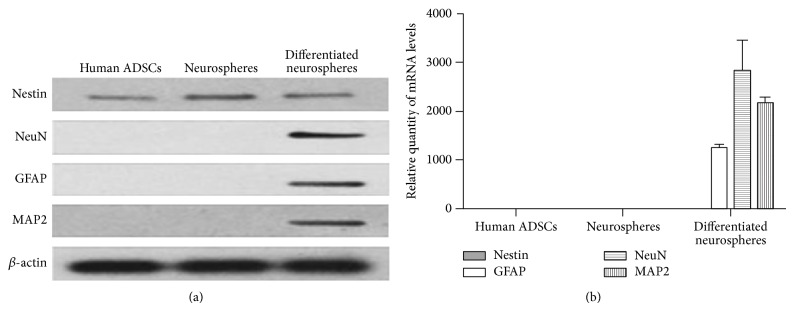
Figure 8.

The expression of Nestin, MAP2, NeuN, and GFAP in cells. (a) Western blotting analysis demonstrated that MAP2, NeuN, and GFAP protein levels in the cells differentiated from neurospheres were upregulated, whereas Nestin expression levels were downregulated compared to those of neurospheres, and the expression of Nestin was the highest in neurospheres. (b) The results from qRT-PCR matched the Western blotting findings: the neural cells showed high expression of MAP2, NeuN, and GFAP at the mRNA level.
