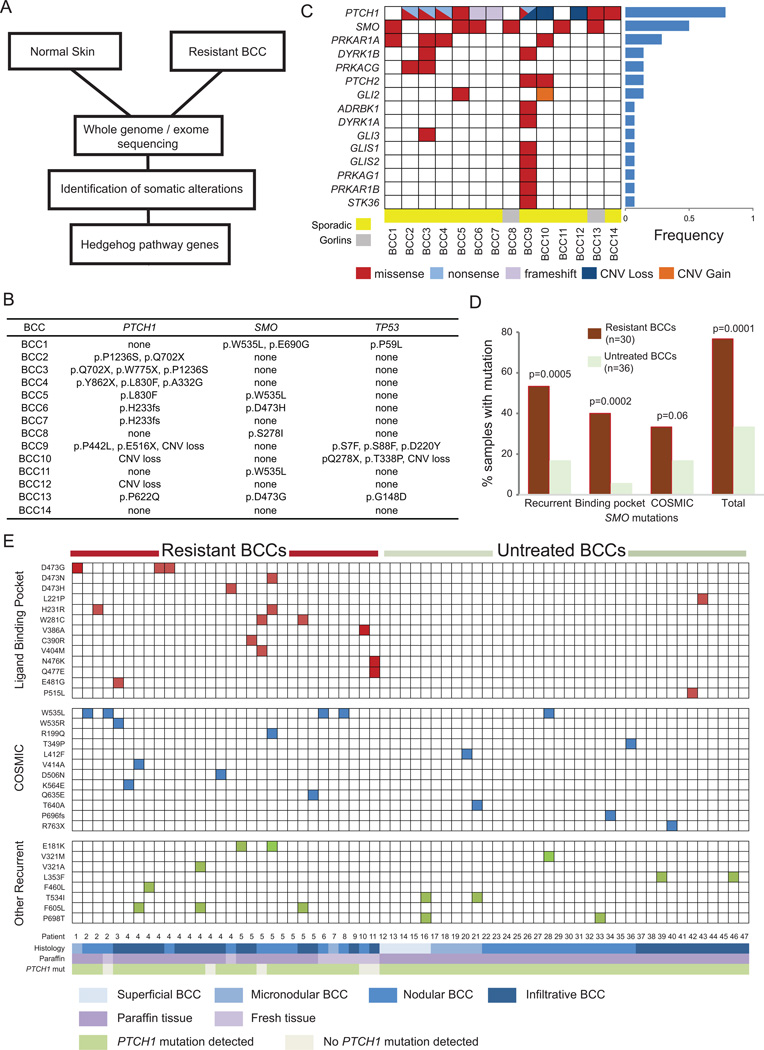
Figure 2. Resistant BCCs harbor recurrent SMO mutations.
(A) Schematic overview of the tumor biopsy and adjacent normal skin collection followed by whole-exome or genome sequencing and analysis. (B) List of SMO, PTCH1, and TP53 mutations identified for each resistant BCC samples subjected to exome sequencing. (C). Spectrum of HH pathway genes with genetic alterations seen in exome sequencing of resistant tumor-normal pairs. The genes are listed on the left hand side and the tumor samples are across the bottom. The fraction of samples with HH pathway mutations is listed in the bar graph to the right. (D) Bar graph showing recurrent, LBP, and COSMIC database SMO mutations in resistant BCCs compared with untreated samples. (E) Schematic showing SMO mutations in resistant BCCs as compared with untreated BCCs. SMO mutations are listed on the left hand side of each row and each column represents a unique sample with patient number and other relevant information listed at the bottom. The mutations are color-coded. Red color: a mutation in an amino acid located in the SMO-LBP. Blue color: a mutation also reported as somatically mutated in cancer in the COSMIC database. Green color: a recurrent mutation in neither the LBP nor the COSMIC database.

