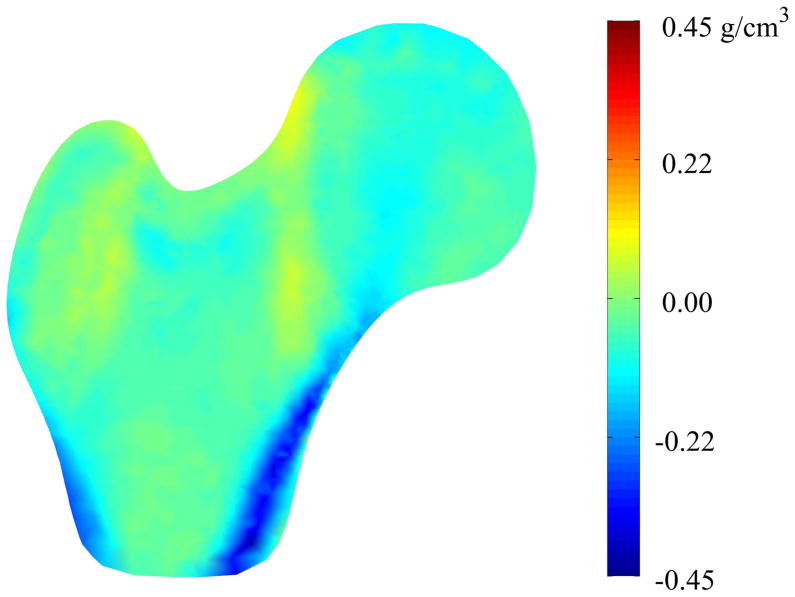
Figure 5. Mid-plane Density Variation between Mean Fracture and Non-Case Femurs.
Color contours represent pointwise density differences between the mean fracture model and the mean non-case model. Accordingly, red regions indicate that those nodes in the case model have greater density than the non-case model at that point and blue regions indicate that the mean case model has less density than the mean non-case model at those points.

