Figure 1.

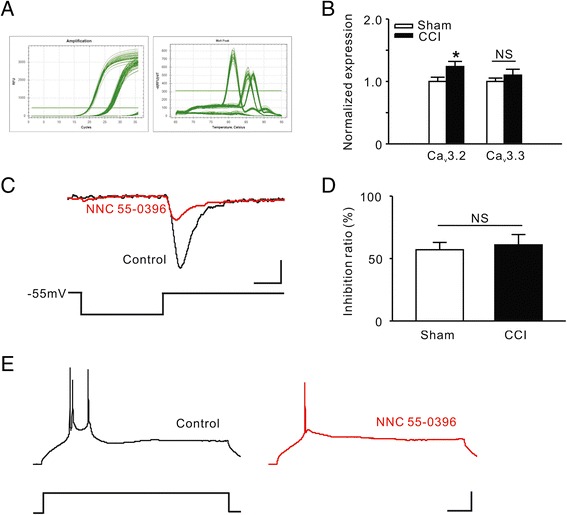
The expression of TCCs in rat ACC. A, Quantitative Real-time PCR standard curves and melt culves. B, Comparison of RNA levels of TCC subunits between the Sham and CCI groups. *P < 0.05 compared to the Sham group. NS, not significant. C, Induction of T-type currents in a pyramidal cell of ACC. Black trace representing the T-type current evoked by transient membrane depolarization, and the red trace representing the attenuated current after NNC 55–0396 (a selective TCC inhibitor, 20 μM) bath application. Scale bars: 20 pA/35 mV and 25 ms. D, Comparison of inhibition ratio of NNC 55–0396 on T-type currents between the Sham and CCI groups. E, TCC mediated burst firing in ACC. Black trace representing a burst firing elicited by a transient current injection, and the red trace representing a single spike elicited by the same current injection after NNC 55–0396 bath application. Scale bars: 20 pA/25 mV and 100 ms.
