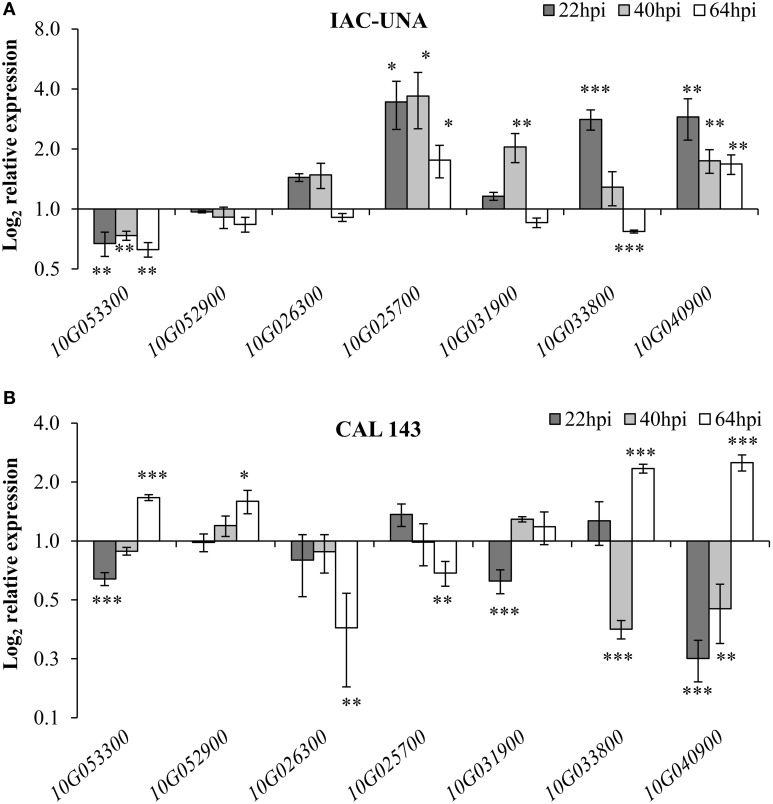
Figure 5.
ALS10.1 genes modulated during common bean interaction with P. griseola. Relative expression of the indicated genes (x-axis) in leaves of the common bean susceptible variety IAC-UNA (A) and in resistant line CAL 143 (B) sprayed with 1 x 10⁴ conidia/ml of P. griseola. Relative expression was calculated based on the gene expression in the mock-inoculated leaves (control) considered as 1. Data points are average of at least two biological replicates and six technical replicates. Asterisks above the standard error bars of all graphs indicate statistical significance calculated with Student's t-test (* p < 0.05, ** p < 0.01, *** p < 0.001).

