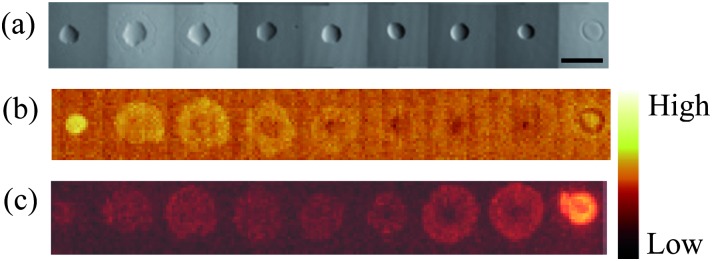
Fig. 3. Analysis of the copolymer series of monomers i and n. From left to right the content (%) of monomer i is 100, 80, 75, 66, 50, 33, 25, 20 and 0. (a) Light microscopy image of the copolymer series. The scale bar is 900 μm. (b and c) ToF-SIMS images of the copolymer series. The ions mapped were (b) C4H– characteristic of monomer i and (c) C5H11O3 – characteristic of monomer n. An intensity scale for the ToF-SIMS images is shown on the right.