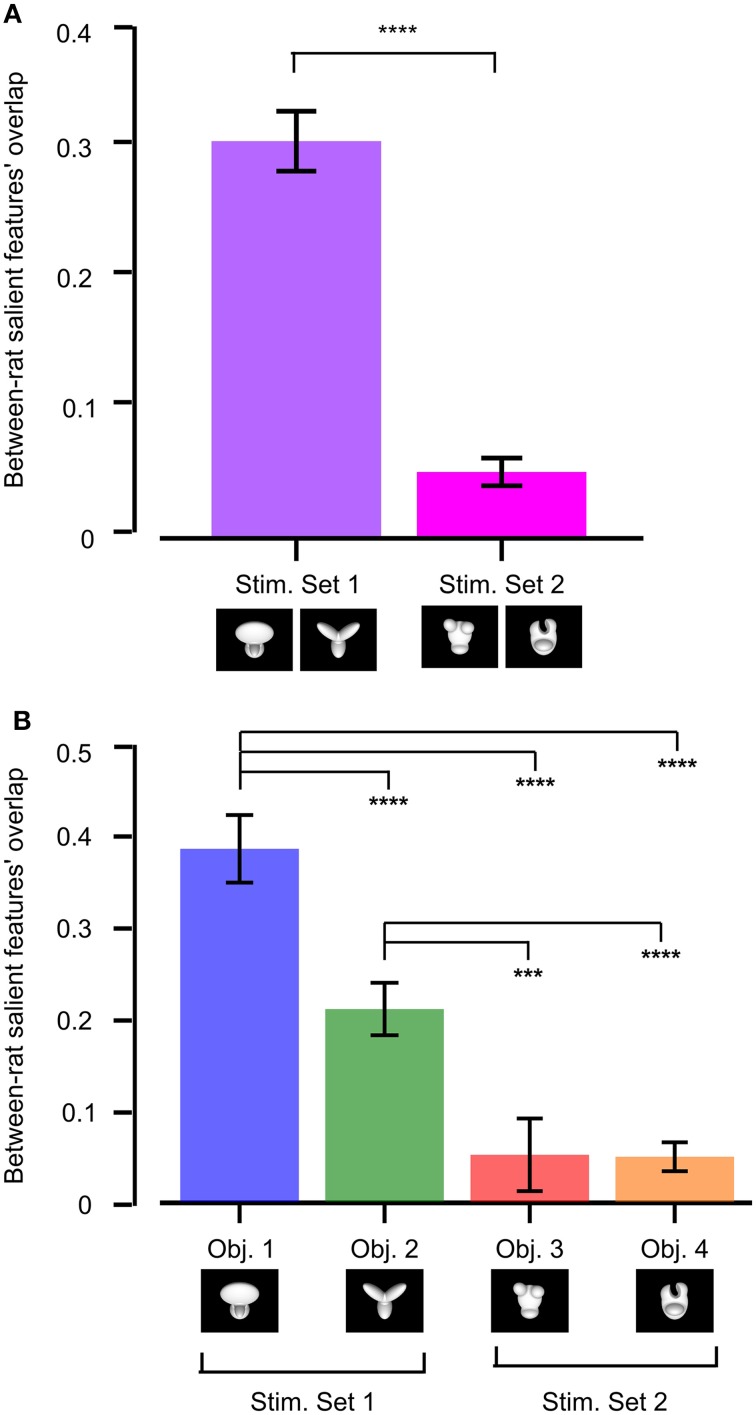
Figure 11.
Between-rat consistency of the recognition strategy. (A) Between-rat consistency of the salient features' patterns obtained for the objects belonging to Stimulus Set 1 and 2. For any given object view, the overlap between the pattern of salient features obtained for two different rats was computed. Overlap values obtained for all the views of the objects within a stimulus set and all possible pairs of rats were polled, yielding the median overlaps per stimulus set shown by the colored bars. (B) Same analysis as in (A), but with the overlap values of individual objects considered independently. In both (A,B), a Mann–Whitney U-test was applied to check whether the resulting medians were significantly different from each other (***p < 0.001, ****p < 0.0001).

