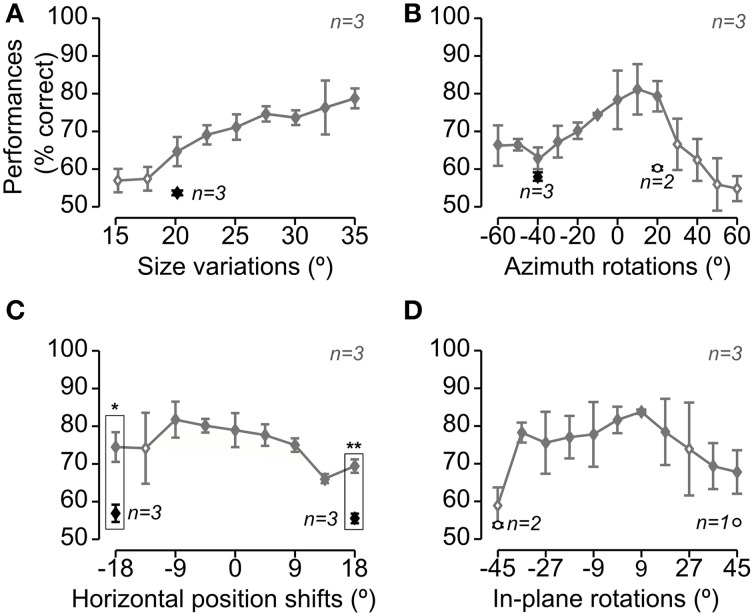
Figure 3.
Rat average recognition performance over the four dimensions along which the objects were transformed. Gray and black symbols show performances in, respectively, regular and bubbles trials that were collected during the same sessions of Experimental Phase II (i.e., in interleaved regular and bubbles trials, as shown in Figure 1H). Panels A–D show the performances obtained, respectively, for size changes (A), azimuth rotations (B), translations (C) and in-plane rotations (D). Solid and open diamonds indicate performances that were, respectively, significantly and non-significantly higher than chance (p < 0.05; one-tailed, unpaired t-test). Open circles refer to conditions (i.e., object views) for which less than 3 rats were tested with the Bubbles method (in this case, the significance of the performance was not tested). The rectangular frames refer to conditions in which the performance in regular trials was significantly larger than in bubbles trials (p < 0.05, one-tailed, paired t-test; again, only conditions for which all three rats were tested, in both regular and bubbles trials, were tested for significance). Error bars: SEM.

