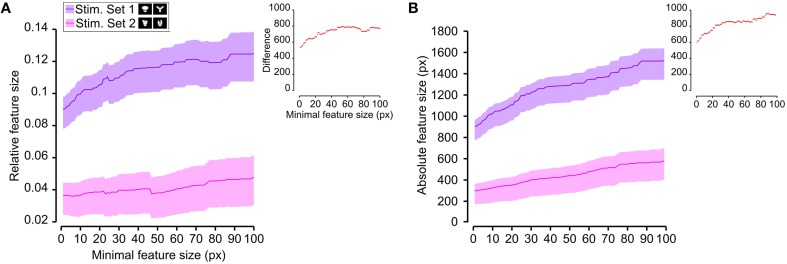
Figure 8.
Average relative and absolute size of the salient features obtained for the two stimulus sets. The average size of the salient features obtained for the views of the objects belonging to either Stimulus Set 1 or 2 (see the caption for the color code) is plotted as a function of the minimal size of the features that were taken into account for this analysis (the average was computed by pooling across all features, all views of both objects within a stimulus set and all rats). The shaded regions are SEM. (A,B) show, respectively, the relative and absolute feature size (with the former computed by dividing the size of each feature by the overall area of the corresponding object view). The insets show the difference between the values obtained for the two stimulus sets (same color code as in Figures 6, 7—black, no significant difference; red, significant difference at p < 0.05; two-tailed, unpaired t-test).

