
Figure 3.
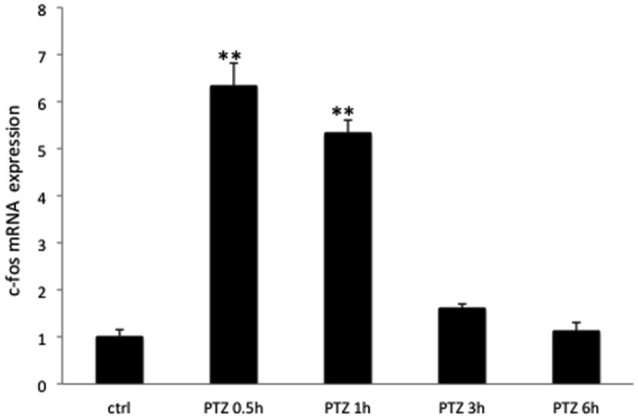
The relative expression pattern of c-Fos mRNA after PTZ seizures in rats. The expression of c-Fos mRNA in groups from Experiment 1 (Control, PTZ 0.5 h; PTZ 1 h, PTZ 3 h, PTZ 6 h) of rats. *p < 0.001.
Official websites use .gov
A
.gov website belongs to an official
government organization in the United States.
Secure .gov websites use HTTPS
A lock (
) or https:// means you've safely
connected to the .gov website. Share sensitive
information only on official, secure websites.
The relative expression pattern of c-Fos mRNA after PTZ seizures in rats. The expression of c-Fos mRNA in groups from Experiment 1 (Control, PTZ 0.5 h; PTZ 1 h, PTZ 3 h, PTZ 6 h) of rats. *p < 0.001.