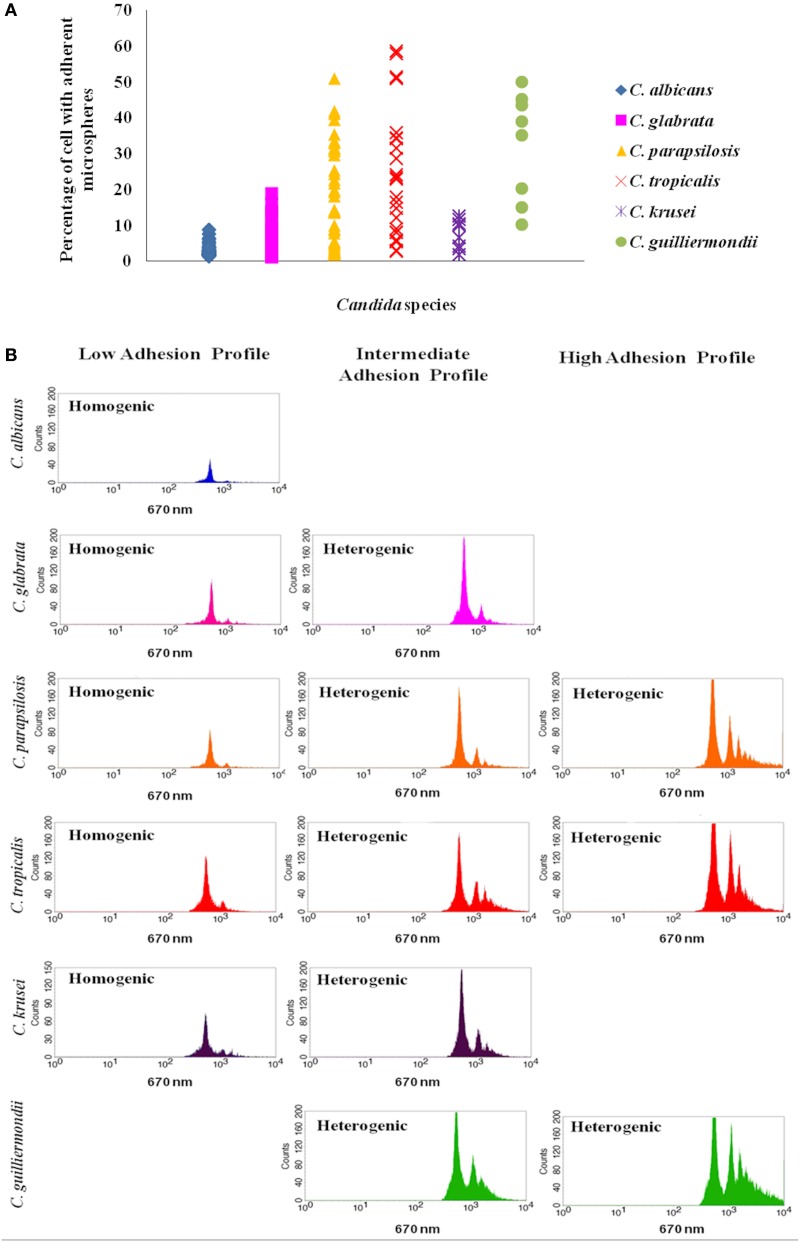
Figure 1.
Representation of Candida adhesion profiles. (A) The species with higher percentage of cells with adherent microspheres are C. guilliermondii, C. tropicalis and C. parapsilosis. Results represent the mean of at least 3 independent experiments, performed in triplicate. (B) Representative histograms illustrate the different distribution patterns that characterize the low, intermediate and high adhesion profiles displayed by each species: homogenic (a homogenous distribution pattern characterizes a population of yeast cells bound to the same number of microspheres, frequently binding to a single microsphere) and heterogenic (a heterogeneous pattern displays the presence of different peaks beyond the third logarithmic decade and indicates that more than a single microsphere is attached to each yeast cell) distribution patterns.

