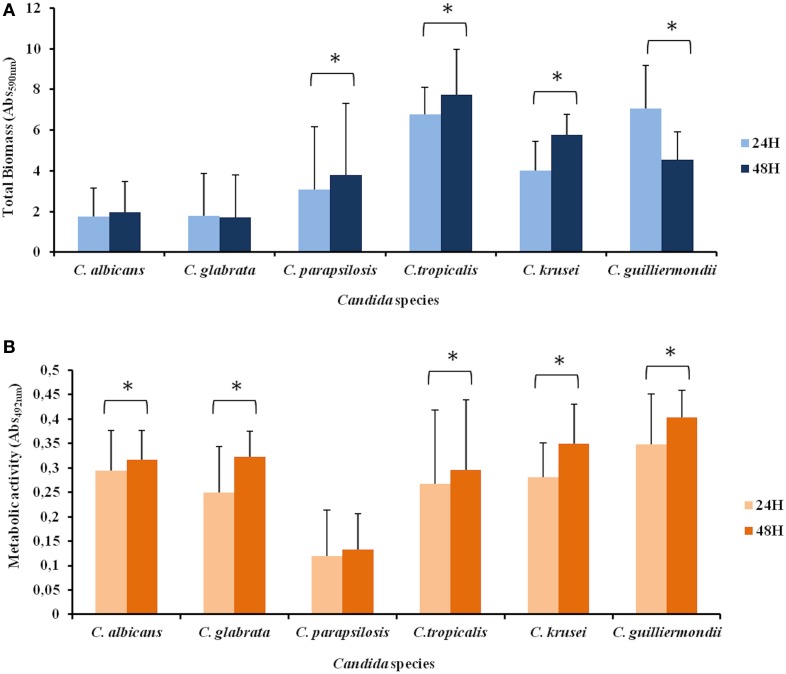
Figure 2.
Biofilm formation by different Candida species. Biofilm was quantified colorimetrically by two different methodologies: (A) Crystal violet assay, that measures biofilm total biomass and (B) XTT assay, which measures biofilm metabolic activity. Error bars represent the standard deviation among results for different isolates. Each isolate was tested for its ability to form biofilm at least 3 times. Asterisks represent cases were a statistically significant difference in the values at 24 and 48 h were observed. Due to asymmetric distribution and sample size, in several comparisons non-parametric tests were used.

