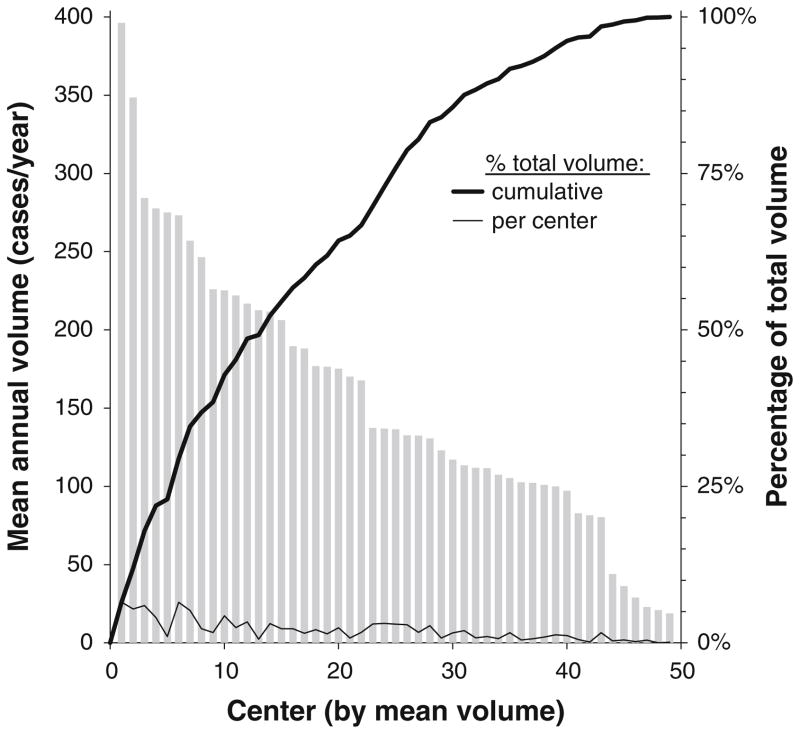
Fig. 2.
Annual volume and contribution of each center to the cohort. Centers are arranged (x-axis) by mean annual volume (bars, left y-axis) regardless of the number of years of participation. The percentage contribution of each center (thick and thin lines, right y-axis) accounts for length of participation

