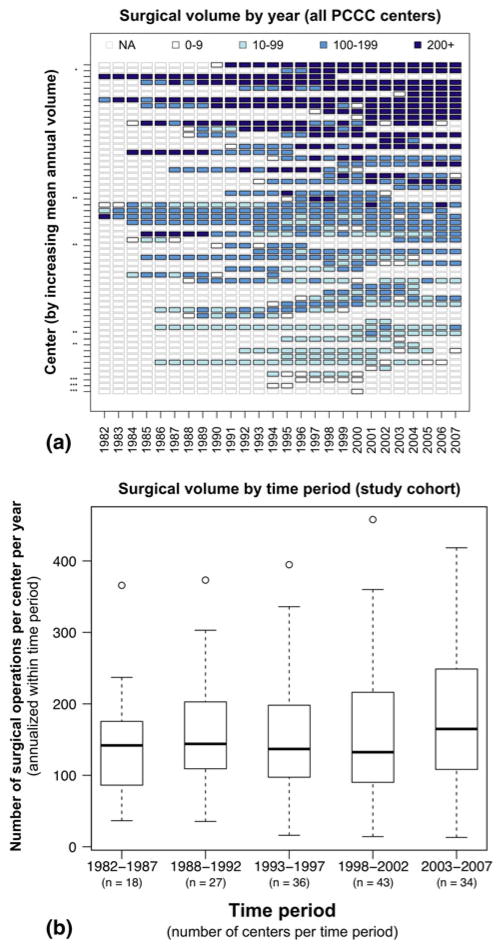
Fig. 3.
Institutional surgical volumes in the PCCC. a Annual center activity (color) for all 57 PCCC centers (y-axis) over time (x-axis). The duration of participation varied among the individual centers (NA = center’s data incomplete or unavailable for that year) and eight centers were excluded. *High transfer rate, **outside North America, ***fewer than ten cases/year. b Statistical distribution of the 49 included centers’ volumes. The x-axis indicates the years and number of centers in each time period, and the y-axis indicates surgical volume annualized by time period. Boxes represent median and IQR (interquartile range, 25–75th percentiles); whiskers represent range within 1.5 × IQR; and circles represent values outside 1.5 × IQR

