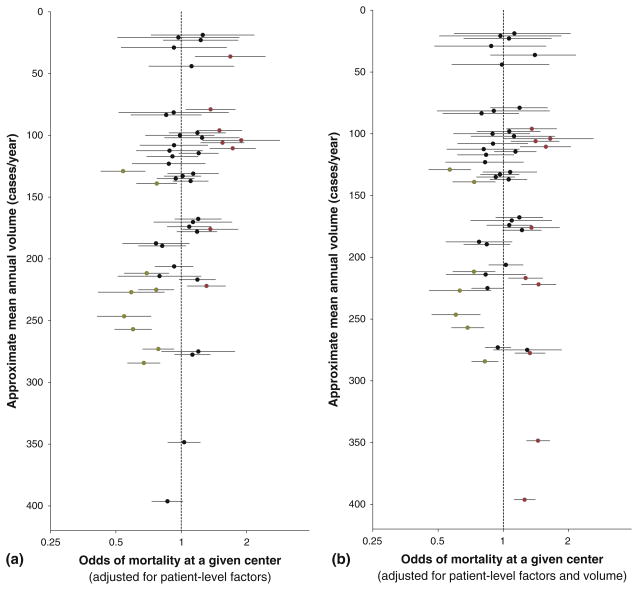
Fig. 6.
Individual center mortality by volume. The 49 analyzed centers are arranged by mean annual surgical volume (y-axis), with odds of mortality (x-axis, log scale) adjusted for a risk category, time period, age group, and sex, or for b risk category, time period, age group, sex, and volume. Symbols are as above, with centers having significantly increased or decreased odds of mortality highlighted respectively in red or green. For some centers, volume was adjusted up or down slightly to prevent overlap in the figure. This did not change the order of the centers or alter any center’s volume by more than two cases per year

