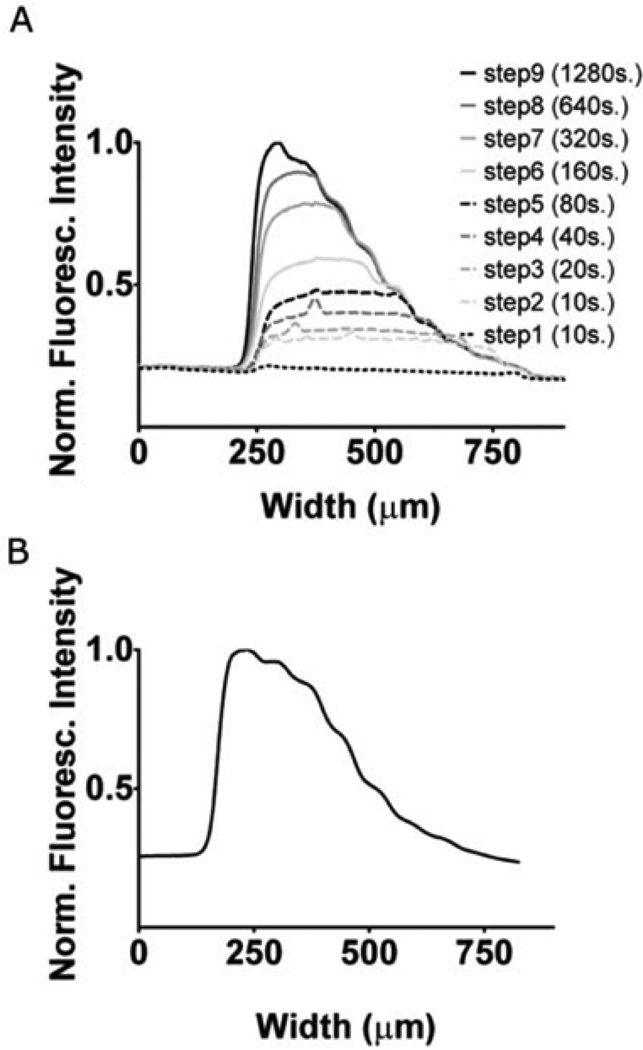
Fig. 2.
(A) Gradient deposition for calibration. The protein used was type IV collagen. Each line shows the fluorescence intensity profile at that step number (step number is indicated in the legend, followed by the duration of the step in brackets). See Table 1 of the ESI for the full parameters. (B) Gradient intensity profile of type IV collagen on a slide containing aldehyde groups covalently bound to glass.

