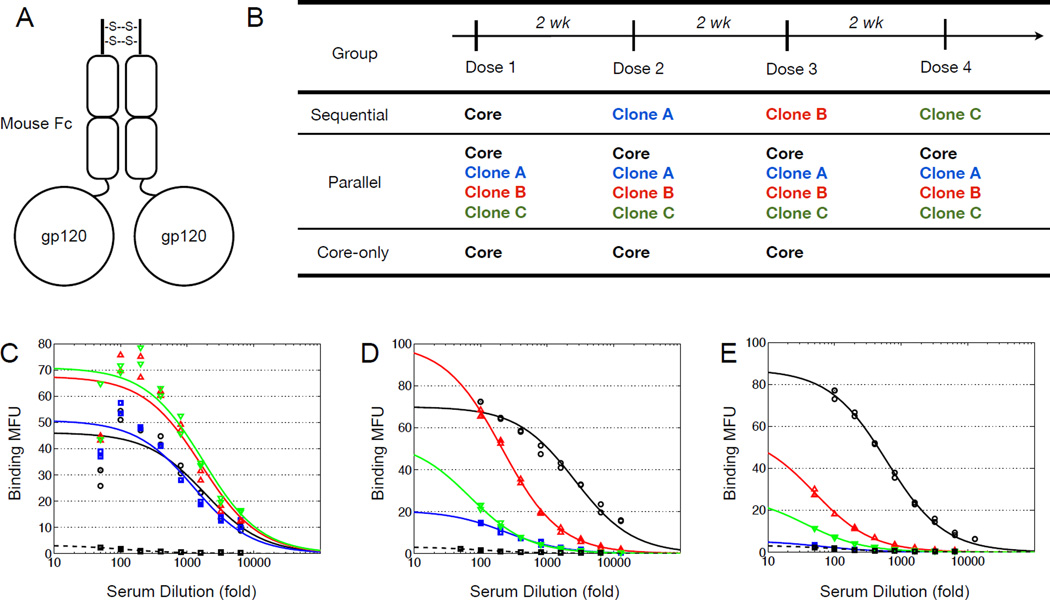
Figure 5. Immunization of mice with variant immunogens.
(A) Schematic of an Fc-gp120 immunogen. (B) Immunization groups and dosing schedule for mouse experiment. (C–E) Serum titrations (day 48) of a representative mouse from each group—(C) sequential, (D) parallel, (E) core-only—on yeast displaying stripped core (black), clone A (blue), clone B (red), or clone C (green). Each plot also includes serum from an unimmunized mouse binding to yeast displaying clone C (black dashed). Binding data is fit to a monovalent binding isotherm of the form where “dil” is the serum dilution and y is the binding signal in MFU. Discussion of the fitted parameters can be found in the supplemental material. See also Supplementary Figure S6 and Table S1.

