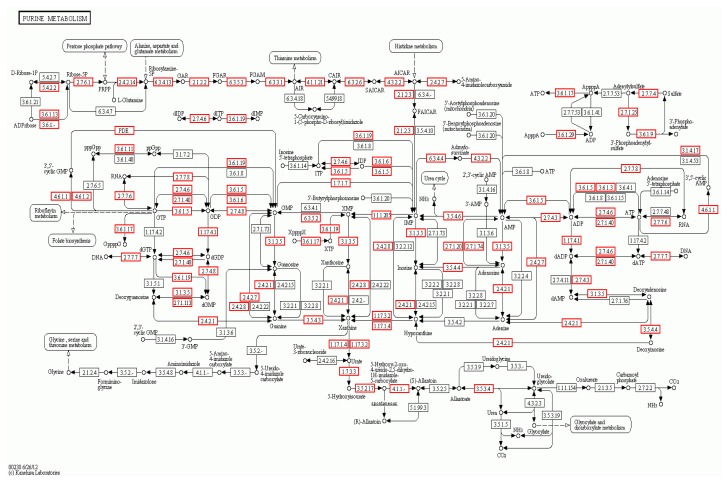
Fig. 11.
Purine metabolism signaling KEGG pathway, which shows the differentially expressed genes in the AS and NC libraries
The red borders indicate the genes that are targets of the differentially expressed miRNAs (Note: for interpretation of the references to color in this figure legend, the reader is referred to the web version of this article)

