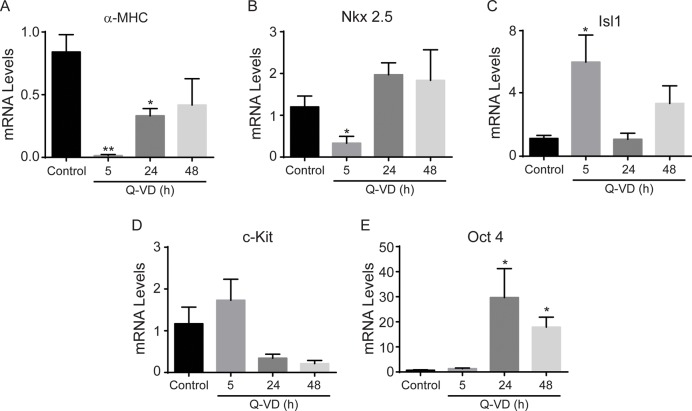
Fig 5. Opposing effects of caspase inhibition on cardiac progenitor cell and differentiation markers expression.
Relative mRNA levels of α-MHC (A), Nkx 2.5 (B), Isl1 (C), c-Kit (D) and Oct-4 (E) in EBs exposed to control vehicle or 10 μM Q-VD-OPH for the indicated times and then cultured for additional 7 days. * p<0.05 vs control, ** p<0.01 vs control.

