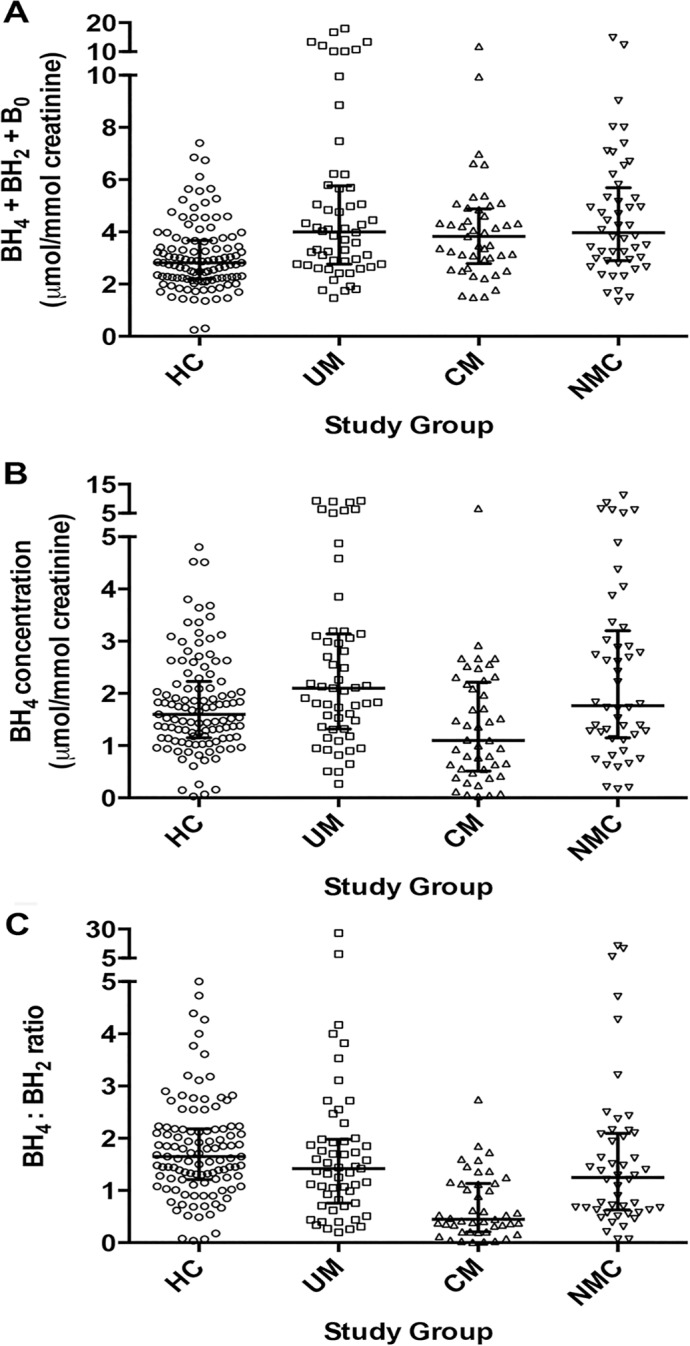
Fig 2. Urine biopterin concentrations at enrollment in the 4 clinical groups.

A: Comparison of total urine biopterins (tetrahydrobiopterin [BH4] + dihydrobiopterin [BH2] + biopterin [B0]) concentrations at enrollment for healthy controls (HC, n = 111), uncomplicated malaria (UM, n = 55), cerebral malaria (CM, n = 45) and non-malaria central nervous system conditions (NMC, n = 48) (p<0.001 by Kruskal-Wallis). B: urine tetrahydrobiopterin (BH4) concentrations at enrollment for all 4 groups (p<0.001 by Kruskal-Wallis). Central line indicates median. Upper and lower lines indicate inter-quartile range. C: Comparison of urine tetrahydrobiopterin to dihydrobiopterin (BH4:BH2) ratio at enrollment for all 4 groups (p<0.001 by Kruskal-Wallis). The number of subjects with a sample measured in [B] and [C] is the same as Noted above in [A]. The central line indicates median. Upper and lower lines indicate interquartile range.
