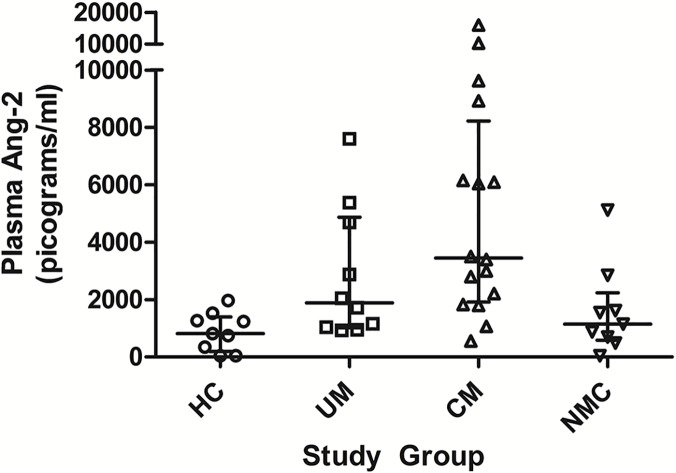
Fig 4. Plasma angiopoietin-2 concentrations at enrollment in the 4 clinical groups.
Comparison of plasma angiopoietin-2 (Ang-2) concentrations at enrollment in a subset of healthy controls (HC, n = 9), uncomplicated malaria (UM, n = 10), cerebral malaria (CM, n = 16) and non-malaria central nervous system conditions (NMC, n = 9) (p<0.001 by Kruskal-Wallis). The central line indicates median. Upper and lower lines indicate inter-quartile range.

