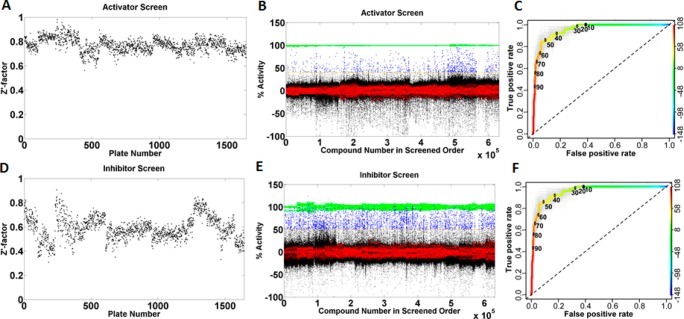
Figure 1.
HTS of 521133 compounds from the St. Jude compound library against PanK3 and ROC analysis of actives. (A) Z′ factor in activator mode. (B) Scatter plot of percentage activity of each well from 1642 384-well plates analyzed in activator mode [green, the positive control for the activator screen consisted of a reaction mixture lacking ATP; red, negative control (DMSO vehicle with complete assay components); blue, compound with activity above cutoff; black, compounds with activity below cutoff. Note: Y-axis is normalized % activity, not raw count.]. (C) ROC analysis of activators showing true (y axis) versus false (x axis) positive rates of percentage compound activity. Light-gray curves represent bootstrap simulation curves. (D) Z′ factor in inhibitor mode. (E) Scatter plot of percentage activity of each well analyzed in inhibitor mode [green, the positive control for the inhibitor screen contained 60 μM acetyl-CoA; red, negative control (DMSO vehicle with complete assay components); blue, compound with activity above cutoff; black, compounds with activity below cutoff. Note: Y-axis is normalized % activity, not raw count.]. (F) ROC analysis of inhibitors.

