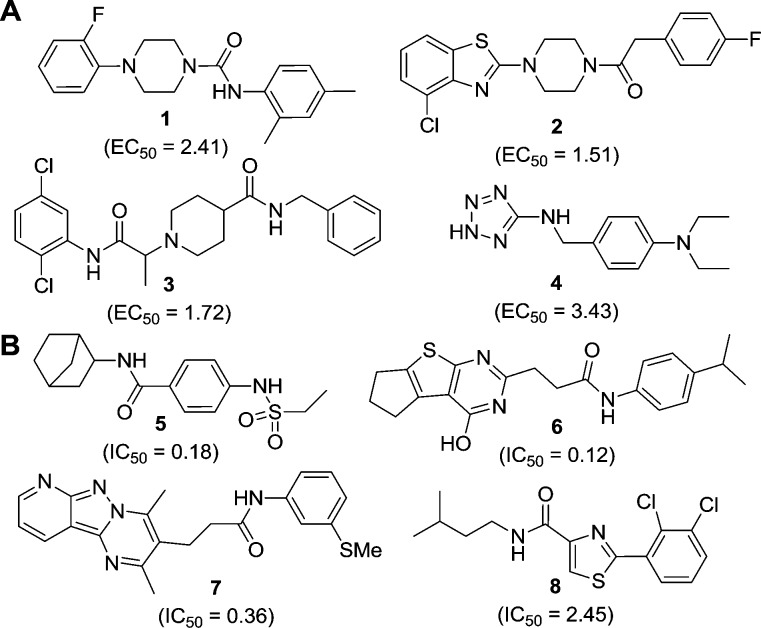
Figure 2.
Structures of representative compounds with different chemical scaffolds characterized as (A) activators (1–4) and (B) inhibitors (5–8) as identified from the HTS. EC50 and IC50 values (μM) represent the activity of the compounds for PanK3 (see Supporting Information, Tables S1 and S2, for detail dose response analysis).

