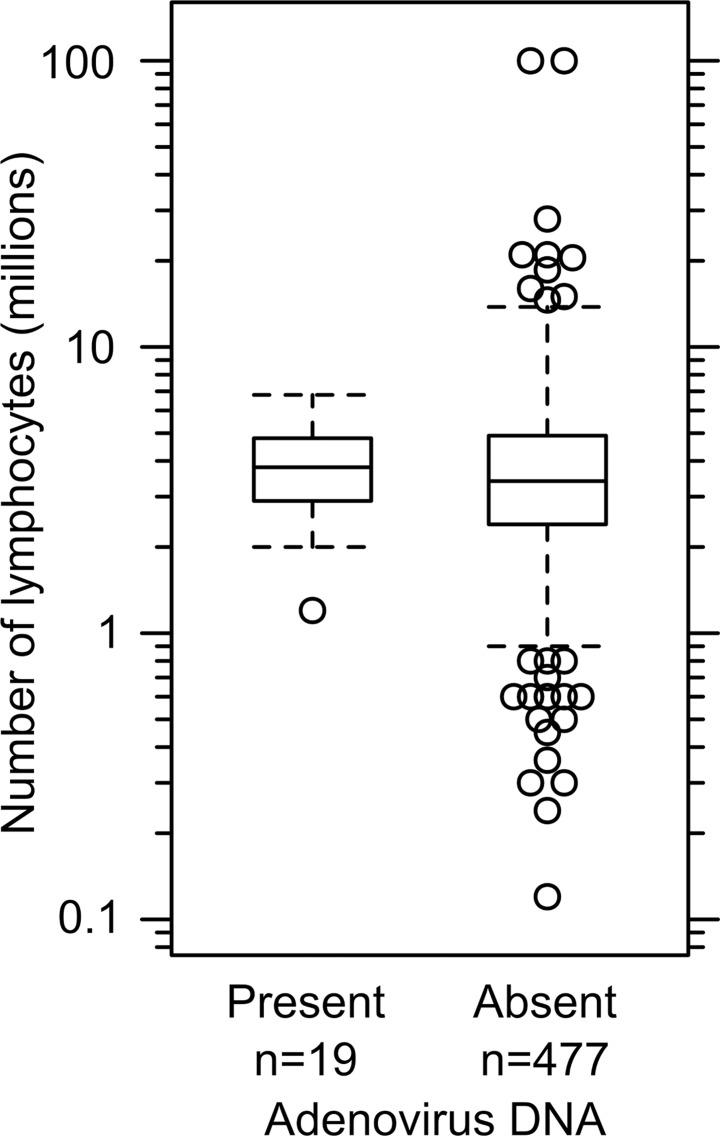
Fig 2. The detection of adenoviral DNA is unrelated to the number of lymphocytes recovered in the cord blood.
The number of lymphocytes in cord blood samples that either contain (Present) or do not contain (Absent) adenoviral DNA show similar distributions. Median values of 3.8×10⁶ and 3.4×10⁶ are indicated by the solid horizontal line. The box spans the interquartile range of log-transformed values. Values beyond 1.5-times the interquartile range are plotted as open circles and whiskers indicate the range of values less than 1.5-times the interquartile range.

