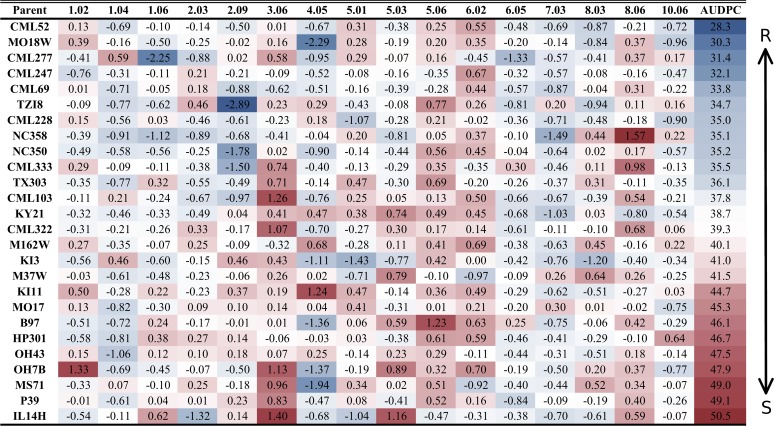
Fig 1. Parental allelic effects at quantitative trait loci.
The bin number is listed in the respective column header between the first and last columns. Two sets of data are presented in this figure. Estimated allelic effects relative to the B73 allele of parental lines at qGLSbin for relative change in disease are listed. The values in the table are the coefficients of the general linear model parameter while the color coding is indicative of area under the disease progress curve. R = resistant; S = susceptible.

