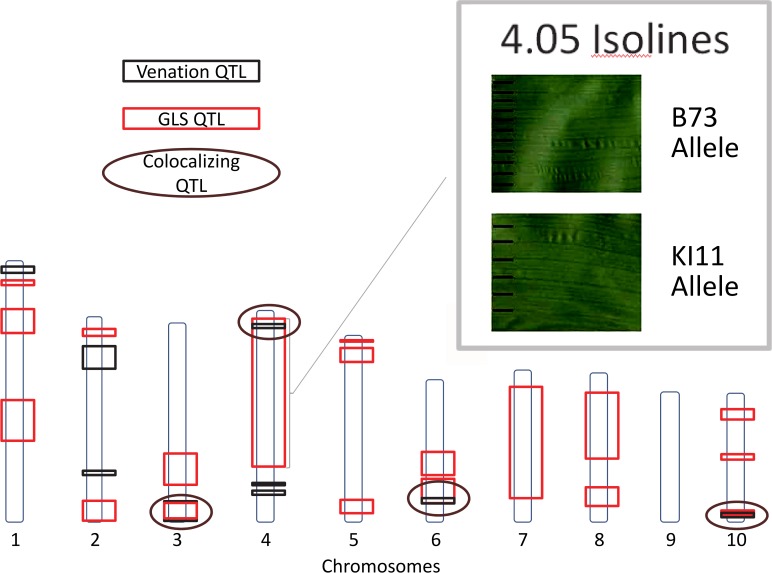
Fig 6. Gray leaf spot (GLS) and venation quantitative trait loci.
Quantitative trait loci for GLS and inter-vein distance (IVD) are indicated. Circles designate co-localizing areas. Scanned leaf images (upper-right corner) demonstrate the difference between IVD from maize leaves with B73 and KI11 alleles at qGLS4.05.

