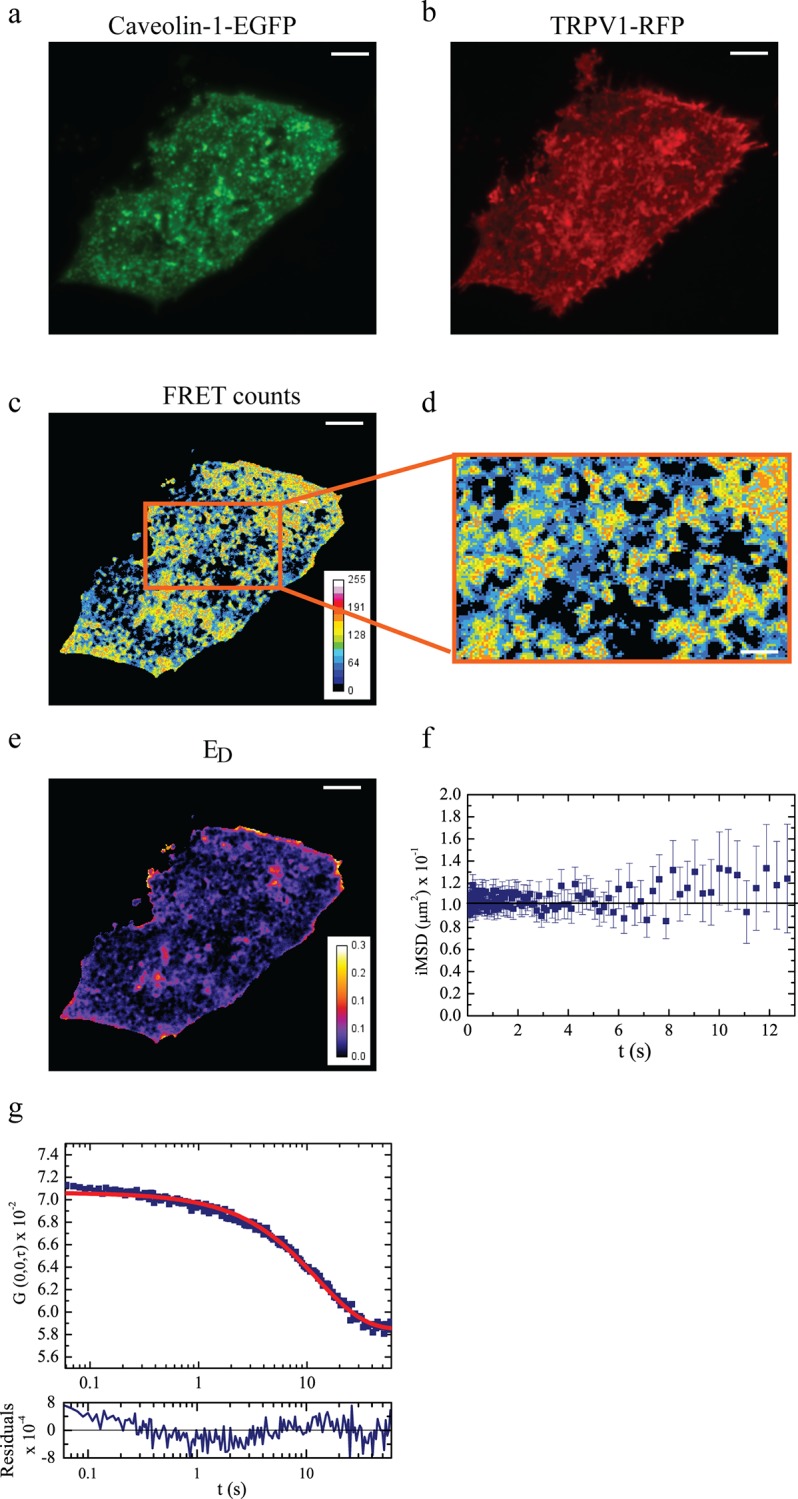
Fig 1. Steady-state and dynamic FRET analysis of TRPV1-Caveolin-1 interaction.

Panel a-e refer to sensitized emission (steady state) FRET. (a) Donor (Caveolin-EGFP) emission image; (b) acceptor (TRPV1-RFP) emission image; (c) SE-FRET intensity image (scale bar: 5 μm); (d) zoom of a cellular region where FRET-iMSD analysis is later performed; (e) donor-normalized apparent FRET efficiency E D. Panels f-g refer to FRET-iMSD analysis. (f) iMSD vs. time plot of FRET signal for the Caveolin-1-EGFP/TRPV1-RFP pair in physiological condition. The constant iMSD clearly demonstrates that the complex is not diffusing in space, i.e. it is trapped within caveolin-positive structures on cellular membrane. (g) Temporal evolution of the binding component: plot of G(0,0,τ) vs. time shows the decrease of correlation function in time. This decrease of STICS function associated to a constant iMSD plot (f) confirms the presence of a binding interaction between TRPV1 and caveolin-1.
