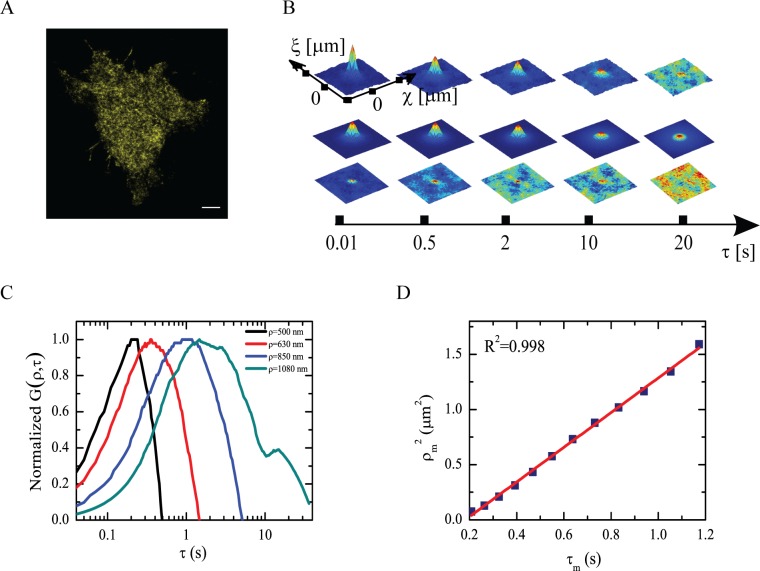
Fig 3. Disclosing of an isotropic TRPV1 component by iMSD analysis on cell transfected with TRPV1-YFP alone.
(a) TIRF microscopy image of a CHO cell expressing TRPV1-YFP. (b) Temporal evolution of the correlation function with the corresponding Gaussian fit and residues. The fitting is a sum of two components that account for binding and superdiffusion regimes. The residuals at short timescale are non-zero and they can be attributed to diffusion of TRPV1 molecule not directly involved in tubulin or caveolin interactions. (c) Average normalized correlation functions of TRPV1 for distances between about 500 nm e 1 μm. The data are smoothed. The position of the maximum of the curves moves at increasing of distance along the time. The shift in the maximum indicates spatial spreading of observed molecules. (d) Plot of position of each maximum identified by and τm. The linear trend (R2 = 0.998) indicates free diffusion at this spatial scale of the TRPV1-I pool.

