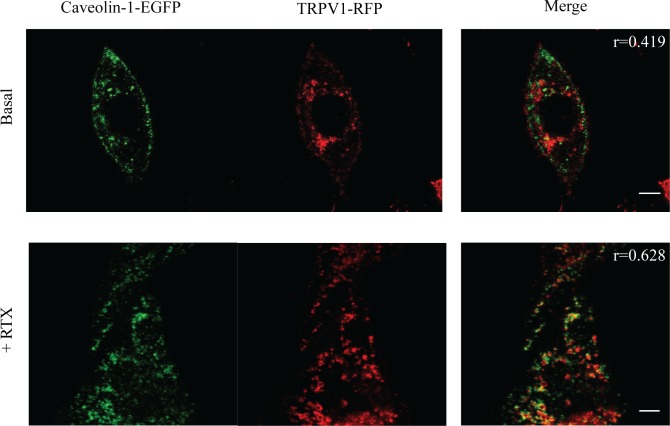
Fig 5. Colocalization experiments between caveolin-1-EGFP and TRPV1-RFP inside cells.
Colocalization between caveolin-1-EFGP and TRPV1-RFP in CHO cells before and after RTX administration. Left panel, Caveolin-1-EGFP emission image; middle panel, TRPV1-RFP emission image; right panels, composite image between Caveolin-1-EGFP and TRPV1-RFP images; the values r in the pictures indicate the Pearson coefficient of images. Scale bar for basal state image: 7.5 μm; scale bar for activated state image: 5 μm.

