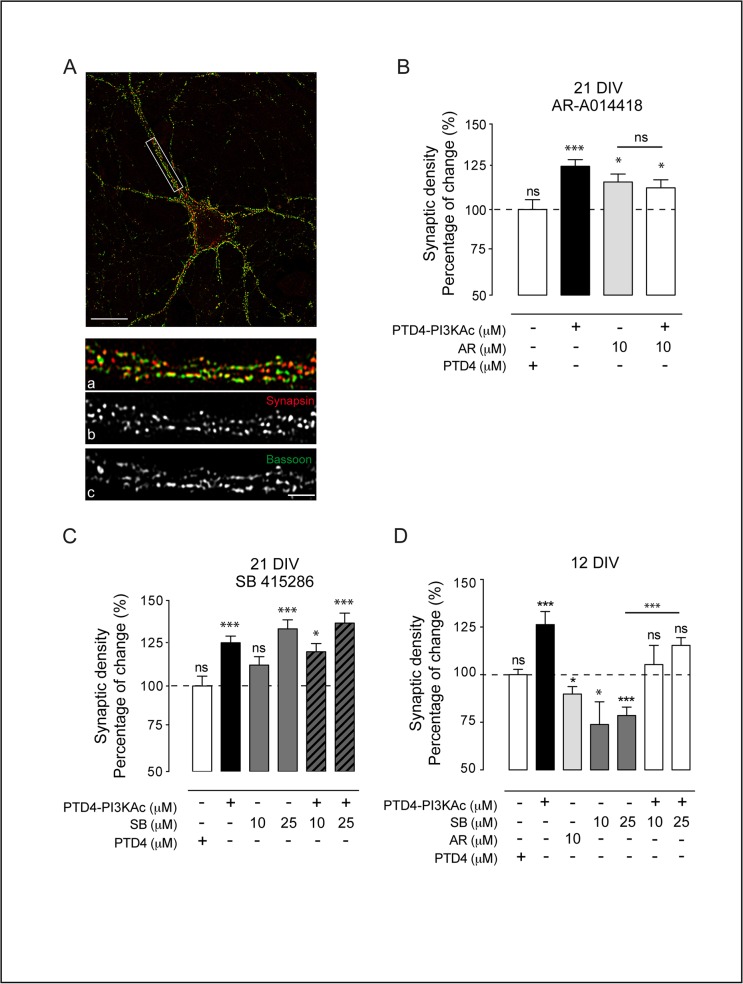
Fig 6. Differential effects of GSK3 inhibition on synaptic density.
A. Example of a 21 DIV hippocampal neuron in culture. Scale bar = 10 μm. Bottom pictures: detailed magnification of the area depicted by the white box. Synapses (a) were localized following a double criterion: puncta positive for Synapsin (b, red) and for Bassoon (c, green). Scale bar 3 μm. B. Plot graph of the average changes in synaptic density at 21 DIV after AR-A014418 treatment. PTD4-PI3KAc and PTD4 were used at 21 μM. C. Plot graph of the results of synaptic density after the GSK3 inhibition by SB 415286 treatment. D. Quantification of synaptic density at 12 DIV after treatments with PTD4-PI3KAc, AR-A014418, SB 415286 alone or in combination with PTD4-PI3KAc. Percentage of change refers to PTD4 control treatment. Cultures were treated for 48 hours before fixation (n = 10–12 from 3 different cultures). Significance refers to the statistical analysis of each experimental condition versus PTD4 treated cultures (100%) Student’s two-tailed t-test, *p<0.05, **p<0.005, ***p<0.0001.

