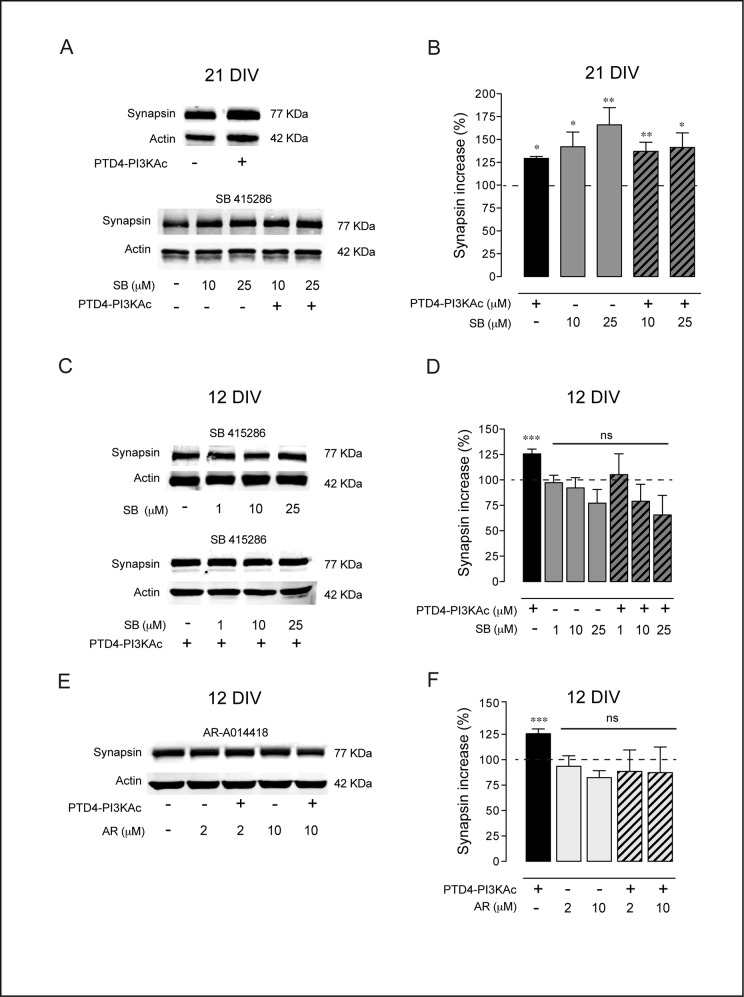
Fig 7. GSK3 inhibition modifies Synapsin levels.
A. Representative immunoblot showing Synapsin levels after GSK3 inhibition by SB 415286 treatment in 21 DIV neuronal hippocampal cultures. B. Plot graph summary of the results of 21 DIV cultures. The bars are the average levels of Synapsin versus control conditions after the indicated treatments, alone or in combination with PTD4-PI3KAc (21 μM). C. Representative immunoblot for Synapsin after GSK3 inhibition in 12 DIV cultures D. Plot graph of Synapsin after SB 415286 treatment, alone or in combination with PTD4-PI3KAc (21 μM). E. Representative immunoblot of Synapsin after GSK3 inhibition by AR-A014418 in 12 DIV cultures. F. Plot bars of the average levels of Synapsin after AR-A014418 treatment, alone or in combination with PTD4-PI3KAc (21 μM). Percentage of Synapsin was normalized to the total Actin levels. n = 10–15 from 6 different cultures. Significance refers to the statistical analysis of the experiments versus the control (100%). Student’s two-tailed t-test, *p<0.05, **p<0.005, ***p<0.0001.

