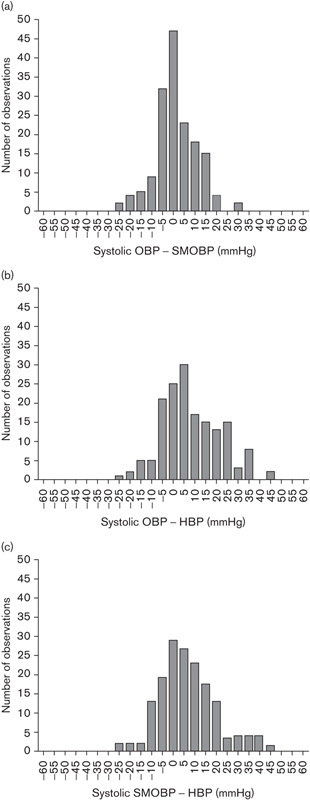
Fig. 1.

(a–c) Frequency distribution of individual differences between self-measured systolic blood pressure at office (SMOBP), office blood pressure (OBP), and mean home blood pressure (HBP) during 7 days. Data are presented for 162 participants, three BP were recorded at each instance but the first BP that was recorded has been omitted out of three, and the mean value of the remaining two BP has been used in the analyses. HBP was measured three times in the morning and three times in the afternoon for 7 days. (a) Frequencies of levels of systolic OBP−SMOBP. (b) Systolic OBP−HBP. (c) Systolic SMOBP−HBP.
