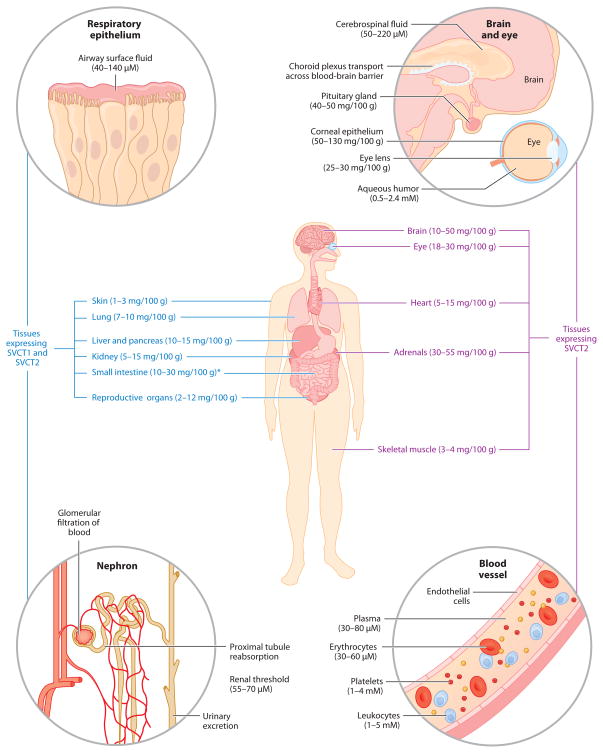
Figure 2.
Tissue distribution of vitamin C and its transport proteins in the human body. Ascorbate concentrations are from limited human data and are represented as mg/100 g wet weight for tissues and molarity (mM or μM) for intracellular and extracellular fluids. Asterisk indicates that the tissue concentrations of ascorbate in the small intestine are heavily dependent on recent dietary intake. Sodium-dependent vitamin C transporter (SVCT) distribution is based on mRNA expression data in animals and human tissues. Republished with permission from Saunders/Elsevier, from Michels, A and Frei B, Vitamin C, in Biochemical, Physiological, and Molecular Aspects of Human Nutrition, third edition, ed. MH Stipanuk, MA Caudill, pp. 626–54, copyright 2012 (62).

