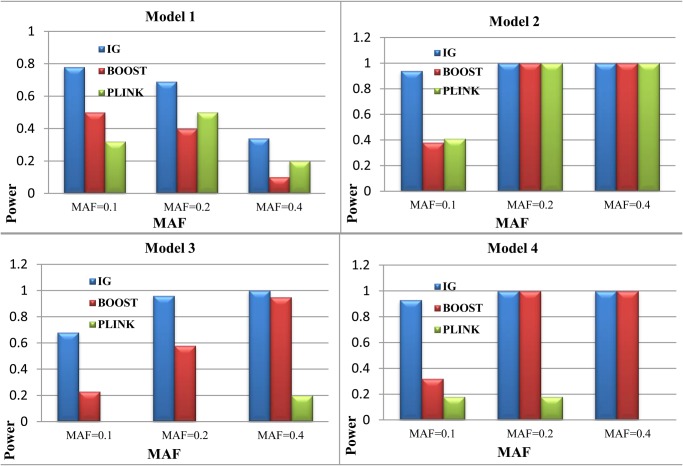
Fig 5. The power comparison between BOOST, PLINK and our method (IG) based on interaction gain.
The power is calculated as the proportion of the 100 data sets in which the interactions of the disease-associated SNPs are detected. The absence of bars indicates no power. MAF means minor allele frequency.

