FIGURE 1:
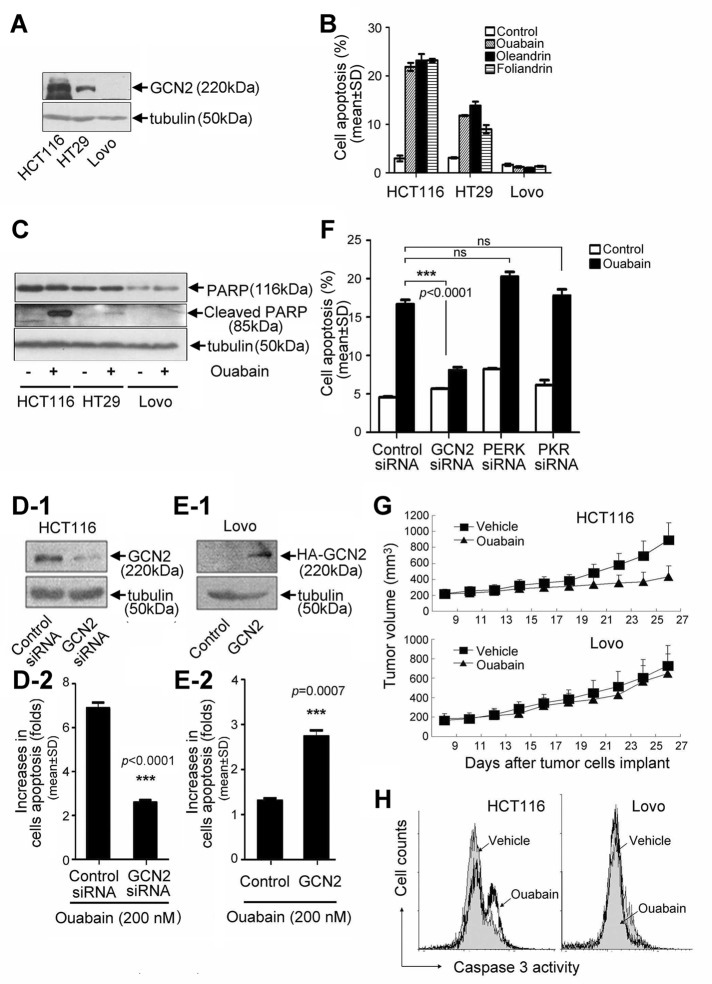
Involvement of GCN2 in Na+,K+-ATPase ligand–induced cell apoptosis. (A) GCN2 protein levels in HCT116, HT29, and LoVo under normal growth conditions. (B) Cell apoptosis and (C) PARP cleavage in HCT116, HT29, and LoVo cells after treatment with ouabain, oleandrin, or foliandrin at 200 nM for 24 h. Data are expressed as mean ± SD, n = 3. HCT116 cells were transfected with GCN2 siRNA or control siRNA (D), and LoVo cells were transfected with HA-GCN2 or empty vector (E), and cells were further treated in the absence or presence of ouabain at 200 nM for additional 24 h. GCN2 level was detected by immunoblot analysis. Cell apoptosis was analyzed by flow cytometry. (F) The control, GCN2, PERK, and PKR siRNA–transfected A549 cells were treated in the absence or presence of ouabain at 200 nM for 24 h. Cell apoptosis was examined by the flow cytometry. Data represent mean ± SD, n = 3; ns, not significant, ***p < 0.001. (G) Nude mice were injected with 3 × 10⁶ HCT116 cells or 5 × 10⁶ LoVo cells per mouse to produce the tumor model. At 25 d after drug treatment, tumor growth curves were plotted. (H) Tumor tissues were removed from animals and homogenized for the assay of caspase 3 cleavage activity by flow cytometry. FITC-DEVD-FMK was used as a specific fluorescent substrate for caspase 3.

