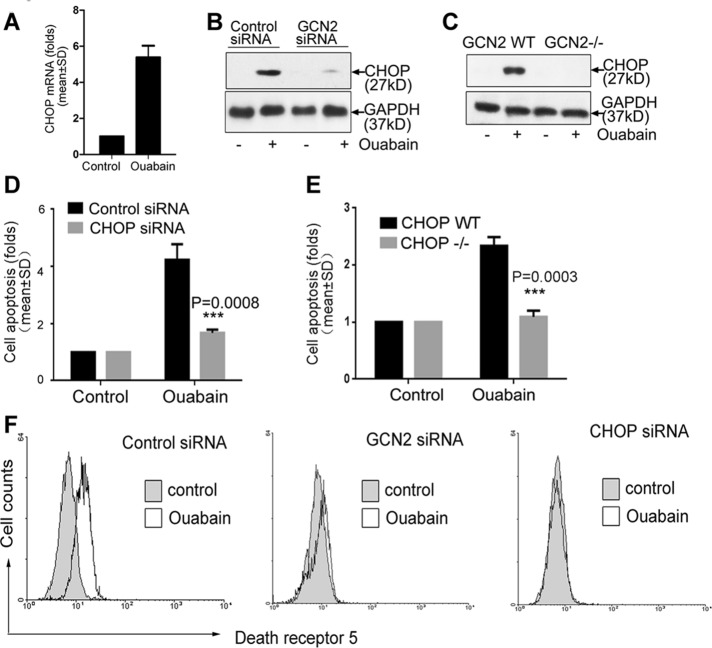
FIGURE 2:
Involvement of CHOP in Na+,K+-ATPase ligand–induced cell apoptosis. (A) A549 cells were treated with ouabain or dimethyl sulfoxide at 400 nM for 12 h. CHOP mRNA was examined by RT-PCR analysis. (B) Control or GCN2-silenced A549 cells were treated with ouabain at 400 nM for 12 h, and (C) GCN2 WT and GCN2−/− MEF cells were treated with ouabain at 10 μM for 12 h, and CHOP expression was examined by immunoblot analysis. (D) A549 cells after silencing of CHOP expression were treated with ouabain at 400 nM for 12 h. Cell apoptosis in control siRNA transfectant was arbitrarily set at 1.0. (E) WT or CHOP−/− MEF cells were treated with ouabain at 10 μM for 12 h; cell apoptosis in CHOP WT MEF cells was arbitrarily set at 1.0. (F) Control, GCN2, or CHOP siRNA–transfected cells were treated with ouabain at 400 nM for 8 h; after treatment, membrane-bound DR5 expression was examined by flow cytometry. Similar results from three independent experiments are shown.

