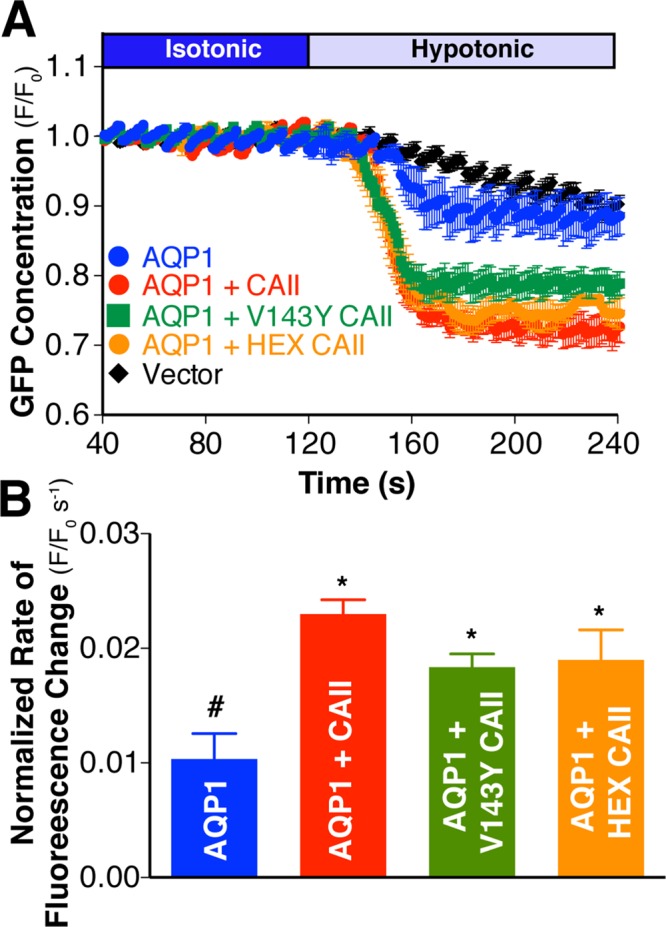
FIGURE 4:

CAII expression increases water flux through AQP1 expressed in HEK293 cells. (A) AQP1 water transport activity was measured by confocal fluorescence microscopy on transfected HEK293 cells. Cells were perfused alternately with isotonic (dark blue bar) and hypotonic (light blue bar) medium, and GFP fluorescence was quantified digitally. GFP concentration as assessed by fluorescence in a representative region of interest (ROI) normalized to initial fluorescence in that ROI (F/F0) is plotted vs. time. (B) Rate of fluorescence change corrected for activity of vector-transfected cells and normalized to AQP1 cell surface expression. Cell surface expression was determined by biotinylation and is presented in Supplemental Figure S7. Asterisk represents a statistically significant difference (p < 0.05) compared with AQP1, and number sign (#) represents a statistically significant difference from AQP1 + CAII.
